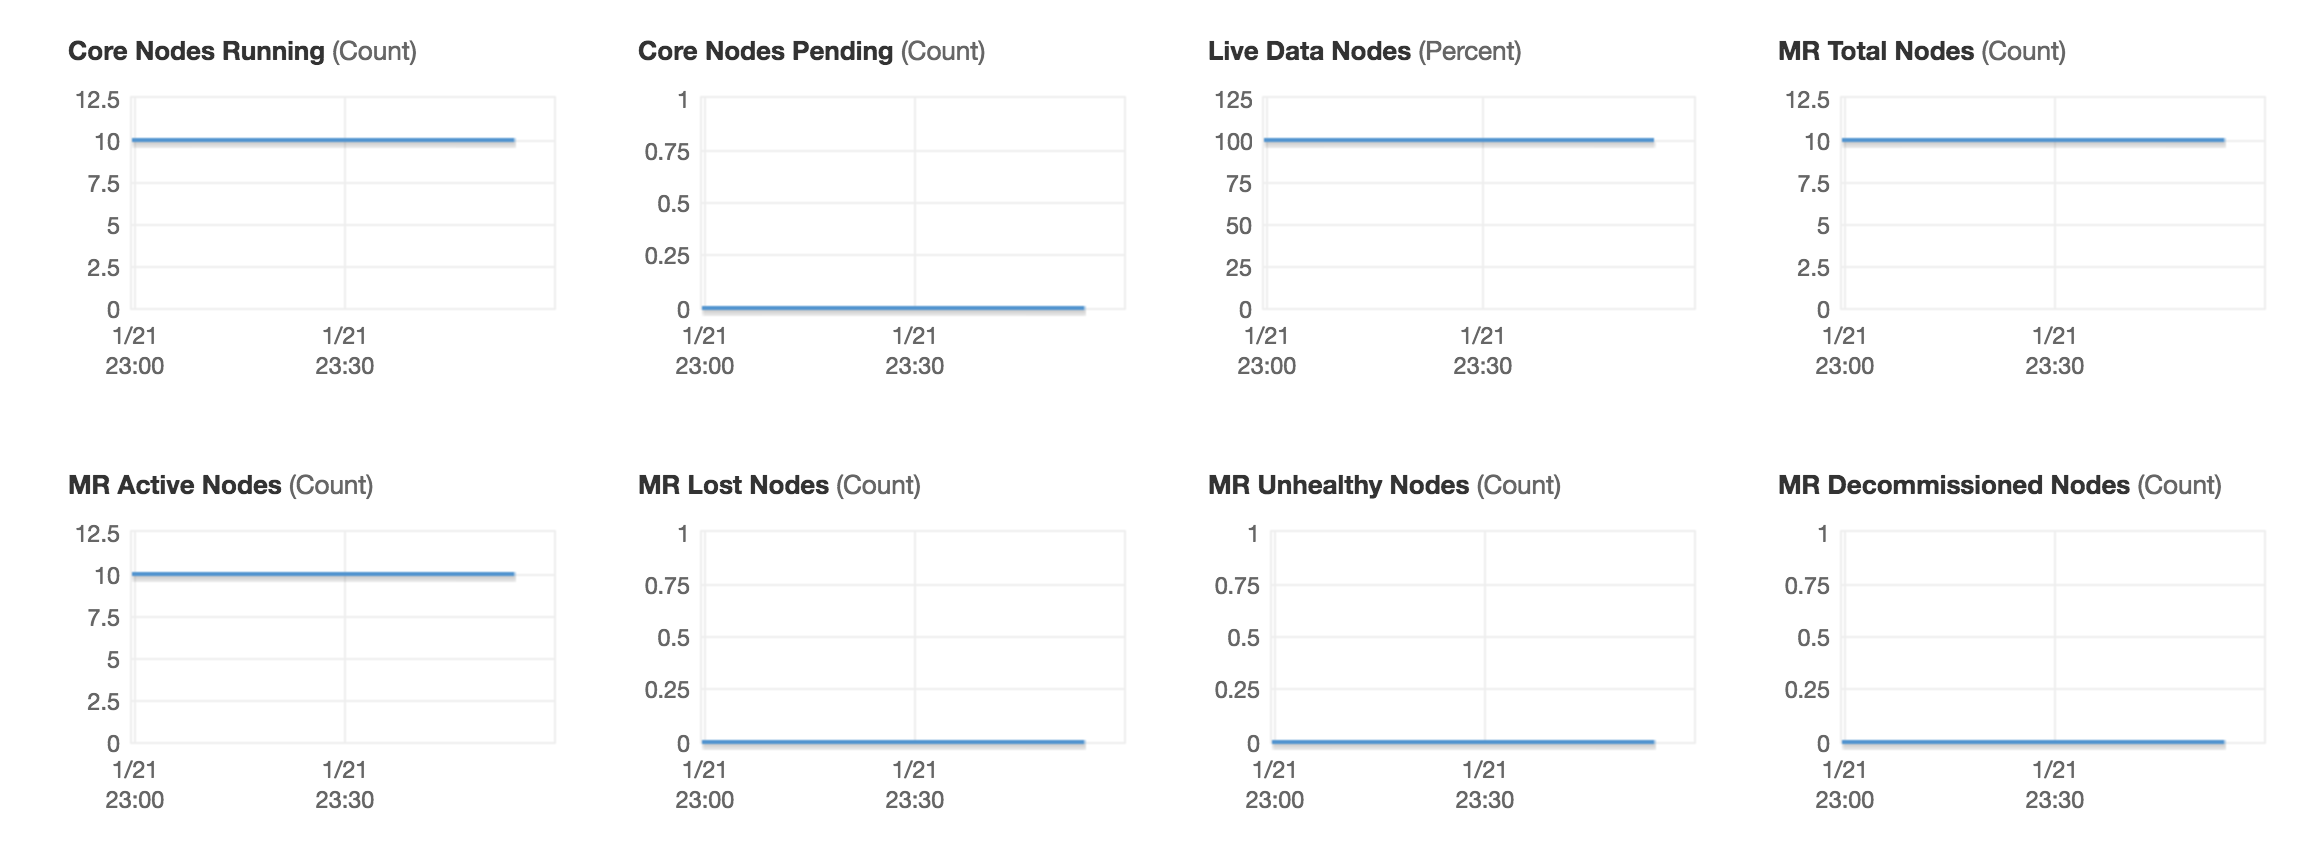
- Total Instances: I have created an EMR with 11 nodes total (1 master instance, 10 core instances).
- job submission:
spark-submit myApplication.py
- graph of containers: Next, I've got these graphs, which refer to "containers" and I'm not entirely what containers are in the context of EMR, so this isn't obvious what its telling me:
- actual running executors: and then I've got this in my spark history UI, which shows that I only have 4 executors ever got created.
- Dynamic Allocation: Then I've got
spark.dynamicAllocation.enabled=Trueand I can see that in my environment details. Executor memory: Also, the default executor memory is at
5120M.Executors: Next, I've got my executors tab, showing that I've got what looks like 3 active and 1 dead executor:
![enter image description here]()
So, at face value, it appears to me that I'm not using all my nodes or available memory.
- how do I know if i'm using all the resources I have available?
- if I'm not using all available resources to their full potential, how do I change what I'm doing so that the available resources are being used to their full potential?


maximizeResourceAllocationand the 4 settings that provide defaults for were completely untouched by me, so the answer to my question is "No". Also, it seems clear now that if I don't manually set those settings and do not enable maximizeResourceAllocation, then my cluster is being used like a 2 node cluster. – Subcartilaginous