How to add text to a specific/fixed location in rasterVis levelplot
Asked Answered
U

1

7

In fact, this question is consist of two questions targeting the same behaviour.

  1. How can I add text (varies by each panel) to a fixed location in panel area? I'm aware of panel.text and latticeExtra::layer solution but it adds text using plotting area coordinates. For instance, I want to add text to bottom-right corner of each panel even if their scales are different.

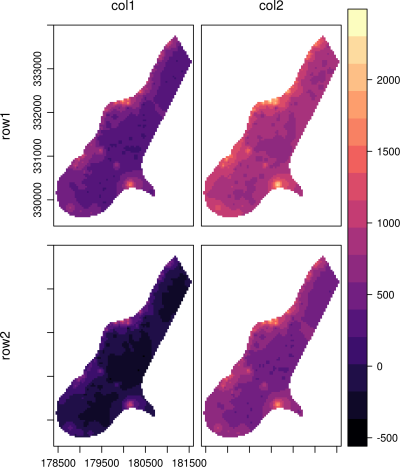
  2. How to add text out of levelplot panel area(s)? Method explained here requires that levelplot has a plot_01.legend.top.vp area to add text which I don't have and the trellis object was plotted before. Besides, I want to add text to left of ylab shown in the figure below. I used ylab here to state the meaning of rows but I need a second ylab that represents y-axis values. I found another question for this problem but It does not work.

Sample plot

The plot above is created by raster::stack object and a rasterVis::levelplot method. I consent to a dirty solution even if I prefer an elegant one. Also despite the question above, I'm open to other approaches that use levelplot.

Upanishad answered 24/3, 2017 at 18:59 Comment(1)
Not sure if it would help but names.attr in levelplot allows you to assign names to each panel. eg. names=c("One","Two","Three") and levelplot(yourstack, names.attr=names)Fifteenth
A
2

A very similar issue is currently being discussed on R-sig-Geo, just have a look at the solution I provided there. Here is the corresponding sample code which lets you add custom text annotations inside or outside the panel regions of a trellis graph using trellis.focus(..., clip.off = TRUE) from lattice.

library(rasterVis)
library(grid)

## sample data
f <- system.file("external/test.grd", package="raster")
r <- raster(f)
s <- stack(r, r+500, r-500, r+200)

p <- levelplot(s, layout = c(2, 2), names.att = rep("", 4), 
               scales = list(y = list(rot = 90)))

## labels
cls <- c("col1", "col2")
rws <- c("row1", "row2")

png("~/rasterVis.png", width = 14, height = 16, units = "cm", res = 300L)
grid.newpage()
print(p, newpage = FALSE)

## loop over panels to be labelled (ie 1:3)
panels  = trellis.currentLayout()
for (i in 1:3) {

  # focus on current panel of interest and disable clipping
  ids <- which(panels == i, arr.ind = TRUE)
  trellis.focus("panel", ids[2], ids[1], clip.off = TRUE)

  # add labels
  if (i %in% c(1, 3)) {
    if (i == 1) {
      grid.text(cls[1], x = .5, y = 1.1)            # add 'col1'
      grid.text(rws[1], x = -.35, y = .5, rot = 90) # add 'row1'
    } else {
      grid.text(rws[2], x = -.35, y = .5, rot = 90) # add 'row2'
    }
  } else {
    grid.text(cls[2], x = .5, y = 1.1)              # add 'col2'
  }

  trellis.unfocus()
}

dev.off()

rasterVis

You may find some further information here:

Alaniz answered 21/7, 2017 at 8:34 Comment(0)

© 2022 - 2024 — McMap. All rights reserved.