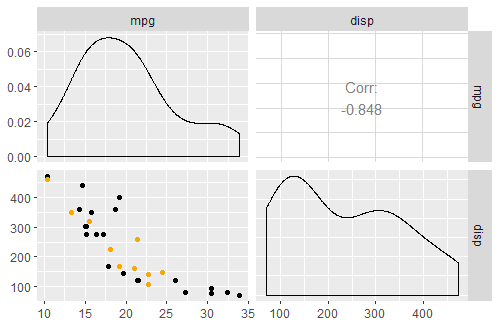
I am trying to create a list object that contains GGally plots. These plots are each created with two datasets, the main dataset and a subset of the main dataset to be plotted again in orange. In the MWE below, three plots are created, each comparing two columns from the mtcars data and each containing a different number of subset points to be plotted in orange:
Plot_1: mpg and cyl, 1 orange overlaid point
Plot_2: mpg and disp, 20 orange overlaid points
Plot_3: mpg and hp, 30 orange overlaid points
library(GGally)
library(ggplot2)

data = mtcars
data$ID = rownames(mtcars)
data = data[, c(12,1:11)]

  my_fn <- function(data, mapping, ...){
    xChar = as.character(mapping$x)
    yChar = as.character(mapping$y)
    x = data[,c(xChar)]
    y = data[,c(yChar)]
    p <- ggplot(data, aes(x=x, y=y)) + geom_point() + geom_point(data = colorData, aes_string(x=xChar, y=yChar), inherit.aes = FALSE)
    p
  }

  ret=list()
  colorVec = c(1, 10, 20)
  k=1
    for (j in c(3:5)){
      datSel <- cbind(ID=data$ID, data[,c(2, j)])
      datSel$ID = as.character(datSel$ID)
      colorData <- datSel[sample(1:nrow(data), colorVec[k]),]
      p <- ggpairs(datSel[,-1], lower = list(continuous = my_fn), upper = list(continuous = wrap("cor", size = 4))) + theme_gray()
      ret[[paste0("Plot_",j)]] <- p
      k=k+1
    }
However, when I run this code, and create the ret list object, only the last plot object in the list successfully creates the plot. The first two list objects cannot find one of the columns in the data.
> ret[["Plot_1"]]
Error in FUN(X[[i]], ...) : object 'cyl' not found

> ret[["Plot_2"]]
Error in FUN(X[[i]], ...) : object 'disp' not found

> ret[["Plot_3"]]
Correctly plotted
What might be a painless way to fix this problem? Thank you in advance for sharing advice.
EDIT:
Adding session info for reproduciblity
> sessionInfo()
R version 3.4.3 (2017-11-30)
Platform: x86_64-apple-darwin15.6.0 (64-bit)
Running under: macOS Sierra 10.12.6

Matrix products: default
BLAS: /System/Library/Frameworks/Accelerate.framework/Versions/A/Frameworks/vecLib.framework/Versions/A/libBLAS.dylib
LAPACK: /Library/Frameworks/R.framework/Versions/3.4/Resources/lib/libRlapack.dylib

locale:
[1] en_US.UTF-8/en_US.UTF-8/en_US.UTF-8/C/en_US.UTF-8/en_US.UTF-8

attached base packages:
[1] stats     graphics  grDevices utils     datasets  methods   base

other attached packages:
[1] ggplot2_2.2.1 GGally_1.3.2

loaded via a namespace (and not attached):
 [1] Rcpp_0.12.15       reshape_0.8.7      grid_3.4.3         plyr_1.8.4         gtable_0.2.0
 [6] magrittr_1.5       scales_0.5.0       pillar_1.2.1       stringi_1.1.6      rlang_0.2.0
[11] reshape2_1.4.3     lazyeval_0.2.1     labeling_0.3       RColorBrewer_1.1-2 tools_3.4.3
[16] stringr_1.3.0      munsell_0.4.3      yaml_2.1.17        compiler_3.4.3     colorspace_1.3-2
[21] tibble_1.4.2


Error in make_ggmatrix_plot_obj(wrapp(sub_type, funcArgName = sub_type_name), : variables: "x" have non standard format: "~mpg". Please rename the columns or make a new column.– Subductggplot2_2.2.1.9000&GGally_1.3.2on Microsoft R Open3.4.3– Subduct