after decoding xml and rendering back on to the canvas graph cell is not showing in mxgraph
Asked Answered
L

1

7

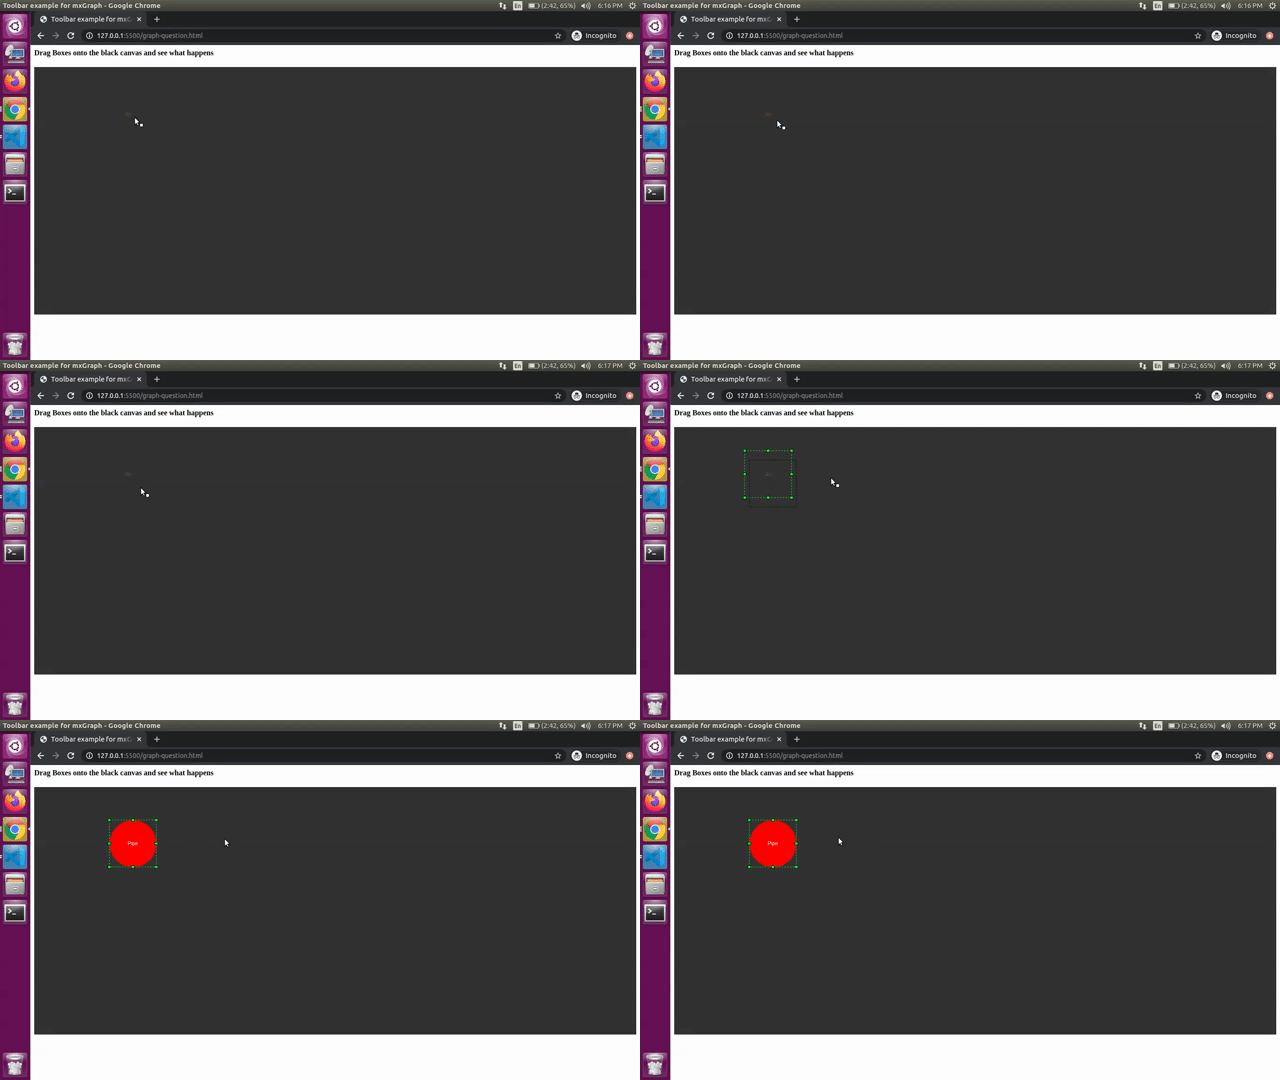
I'm able to decode graph xml model successfully but the cell is not visible until the drag

below GIF shows my problem

enter image description here

Question: I want to load the graph fully for the 1st(now showing only div) time also without need for drag

Here is how I'm doing decoding and rendering xml

var graphXmlStr = ''//xmldata
var doc = mxUtils.parseXml(graphXmlStr)
var codec = new mxCodec(doc);
codec.decode(doc.documentElement, graph.getModel());
      

I'm using below code for html graph.htmlLabels below code I need

  graph.convertValueToString = function(cell) {
    return cell.value;
  }

Below is my full code

<html>

    <head>
        <title>Toolbar example for mxGraph</title>
        <style>
            #graph-wrapper {
                background: #333;
                width: 100%;
                height: 528px;
            }
        </style>
        <script type="text/javascript">
            mxBasePath = 'https://jgraph.github.io/mxgraph/javascript/src';
        </script>
        <script src="https://jgraph.github.io/mxgraph/javascript/src/js/mxClient.js"></script>
    </head>
    
    <body onload="initCanvas()">
        <h4>find div text and drag it , as you drag it will become visible</h4>
    
        <div id="graph-wrapper">
        </div>
      <script>

var graph;

function initCanvas() {

  //This function is called onload of body itself and it will make the mxgraph canvas
  graph = new mxGraph(document.getElementById('graph-wrapper'));
  graph.htmlLabels = true;
  graph.cellsEditable = false;

    graph.model.beginUpdate();
    var graphXmlStr =  `<mxGraphModel><root><mxCell id="0"/><mxCell id="1" parent="0"/><div xmlns="http://www.w3.org/1999/xhtml" id="2" style="width: 100px; height: 100px; border-radius: 50%; background: red; display: inline-flex; text-align: center; color: #fff; align-items: center; justify-content: center;">&#xa;                Pipe&#xa;           <mxCell xmlns="" style="fillColor=none;strokeColor=none" vertex="1" parent="1"><mxGeometry x="150" y="50" width="100" height="100" as="geometry"/></mxCell></div></root></mxGraphModel>`;
    var doc = mxUtils.parseXml(graphXmlStr);
    var codec = new mxCodec(doc);
    codec.decode(doc.documentElement, graph.getModel());
    graph.model.endUpdate();

    // render as HTML node always. You probably won't want that in real world though
    graph.convertValueToString = function(cell) {
        return cell.value;
    }

} 
      </script>
    </body>
    </html>

Please help me thanks in advance!!!

Lungwort answered 18/6, 2021 at 10:24 Comment(2)
i have edited my question, and even simplified it please help me thanks in advance!!Lungwort
started bounty please check once againLungwort
S
2

I found it you have to call graph.refresh();.

<html>

    <head>
        <title>Toolbar example for mxGraph</title>
        <style>
            #graph-wrapper {
                background: #333;
                width: 100%;
                height: 528px;
            }
        </style>
        <script type="text/javascript">
            mxBasePath = 'https://jgraph.github.io/mxgraph/javascript/src';
        </script>
        <script src="https://jgraph.github.io/mxgraph/javascript/src/js/mxClient.js"></script>
    </head>
    
    <body onload="initCanvas()">
        <h4>find div text and drag it , as you drag it will become visible</h4>
    
        <div id="graph-wrapper">
        </div>
      <script>

var graph;

function initCanvas() {

  //This function is called onload of body itself and it will make the mxgraph canvas
  debugger
  graph = new mxGraph(document.getElementById('graph-wrapper'));
  graph.htmlLabels = true;
  graph.cellsEditable = false;

    graph.model.beginUpdate();
    var graphXmlStr =  `<mxGraphModel><root><mxCell id="0"/><mxCell id="1" parent="0"/><div xmlns="http://www.w3.org/1999/xhtml" id="2" style="width: 100px; height: 100px; border-radius: 50%; background: red; display: inline-flex; text-align: center; color: #fff; align-items: center; justify-content: center;">&#xa;                Pipe&#xa;           <mxCell xmlns="" style="fillColor=none;strokeColor=none" vertex="1" parent="1"><mxGeometry x="150" y="50" width="100" height="100" as="geometry"/></mxCell></div></root></mxGraphModel>`;
    var doc = mxUtils.parseXml(graphXmlStr);
    var codec = new mxCodec(doc);
    codec.decode(doc.documentElement, graph.getModel());
    graph.model.endUpdate();
    
    //graph.graphModelChanged([])
    // render as HTML node always. You probably won't want that in real world though
    graph.convertValueToString = function(cell) {
        return cell.value;
    }
    
    graph.refresh();

} 
      </script>
    </body>
    </html>
Siddra answered 21/6, 2021 at 5:37 Comment(7)
no i want same element with same shape as asked in question. please replicate that and show same shape on load itselfLungwort
1 more thing to add the fillColor is there on the model itself why i need to add it back. let say if i have 100 shapes with different color i need to add it for all (not practical)Lungwort
Are you using JQuery? I don't see any reference to it. If so, I would start the script with the $().ready(function () { and get rid of the onload call. You can also add a console.log to see if your function is being called more than once.Glomerule
@eabengaluru I edit my post and apparently everything is working wellSiddra
@AlirezaAhmadi, ya it is working as expected i will reward bounty before it expiresLungwort
@AlirezaAhmadi please check nowLungwort
ok i will do that too, thanks alot for your answerLungwort

© 2022 - 2024 — McMap. All rights reserved.