I wrote some code to estimate the horizontal lines from the printed letters in the page. The same could be done for vertical ones I guess. The code below follows some general assumptions, here
some basic steps in pseudo code style:
prepare picture for contour detection
do contour detection
we assume most contours are letters
- calc mean width of all contours
- calc mean area of contours
filter all contours with two conditions:
a) contour (letter) heigths < meanHigh * 2
b) contour area > 4/5 meanArea
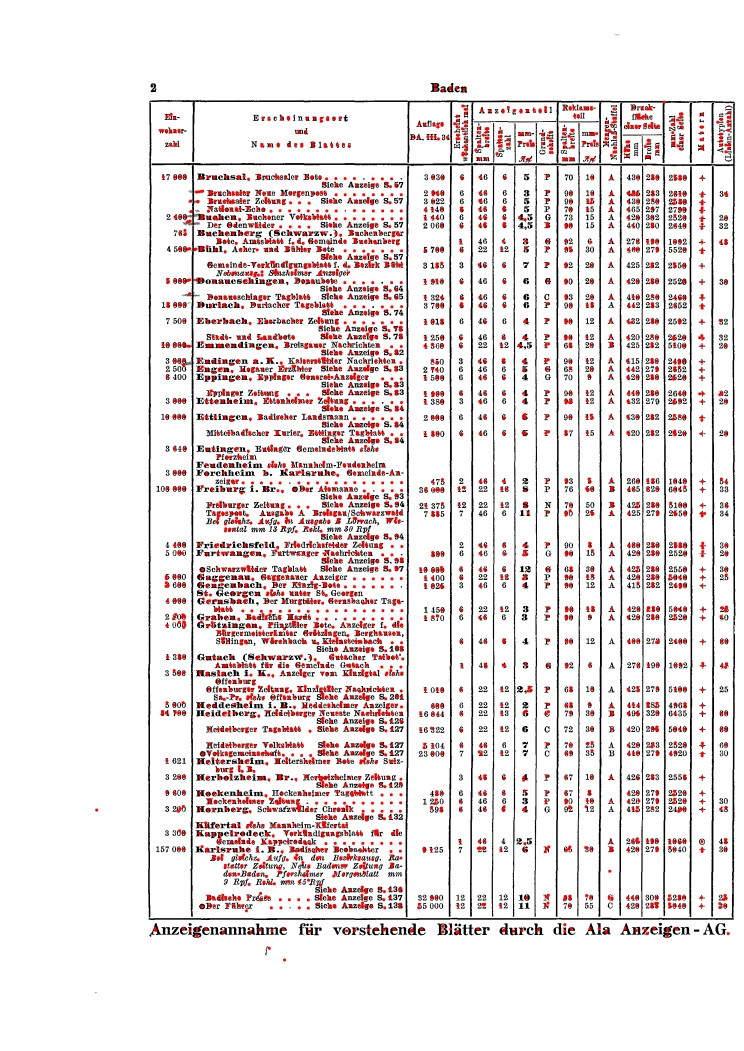
calc center point of all remaining contours
assume we have line regions (bins)
- list all center point which are inside the region
- do linear regression of region points
- save slope and intercept
calc mean slope and intercept
here the full code:
import cv2
import numpy as np
from scipy import stats

def resizeImageByPercentage(img,scalePercent = 60):
    width = int(img.shape[1] * scalePercent / 100)
    height = int(img.shape[0] * scalePercent / 100)
    dim = (width, height)
    # resize image
    return cv2.resize(img, dim, interpolation = cv2.INTER_AREA)

def calcAverageContourWithAndHeigh(contourList):
    hs = list()
    ws = list()
    for cnt in contourList:
        (x, y, w, h) = cv2.boundingRect(cnt)
        ws.append(w)
        hs.append(h)
    return np.mean(ws),np.mean(hs)

def calcAverageContourArea(contourList):
    areaList = list()
    for cnt in contourList:
        a = cv2.minAreaRect(cnt)
        areaList.append(a[2])
    return np.mean(areaList)

def calcCentroid(contour):
    houghMoments = cv2.moments(contour)
    # calculate x,y coordinate of centroid
    if houghMoments["m00"] != 0: #case no contour could be calculated
        cX = int(houghMoments["m10"] / houghMoments["m00"])
        cY = int(houghMoments["m01"] / houghMoments["m00"])
    else:
    # set values as what you need in the situation
        cX, cY = -1, -1
    return cX,cY

def getCentroidWhenSizeInRange(contourList,letterSizeWidth,letterSizeHigh,deltaOffset,minLetterArea=10.0):
    centroidList=list()
    for cnt in contourList:
        (x, y, w, h) = cv2.boundingRect(cnt)
        area = cv2.minAreaRect(cnt)

        #calc diff
        diffW = abs(w-letterSizeWidth)
        diffH = abs(h-letterSizeHigh)
        #thresold A: almost smaller than mean letter size +- offset
        #when almost letterSize
        if diffW < deltaOffset and diffH < deltaOffset:
            #threshold B > min area
            if area[2] > minLetterArea:
                cX,cY = calcCentroid(cnt)
                if cX!=-1 and cY!=-1:
                    centroidList.append((cX,cY))
    return centroidList

DEBUGMODE = True
#read image, do git clone https://github.com/WZBSocialScienceCenter/pdftabextract.git for the example
img = cv2.imread('pdftabextract/examples/catalogue_30s/data/ALA1934_RR-excerpt.pdf-2_1.png')
#get some basic infos
imgHeigh, imgWidth, imgChannelAmount = img.shape

if DEBUGMODE:
    cv2.imwrite("img00original.jpg",resizeImageByPercentage(img,30))
    cv2.imshow("original",img)

# prepare img
imgGrey = cv2.cvtColor(img, cv2.COLOR_BGR2GRAY)
# apply Gaussian filter
imgGaussianBlur = cv2.GaussianBlur(imgGrey,(5,5),0)
#make binary img, black or white
_, imgBinThres = cv2.threshold(imgGaussianBlur, 130, 255, cv2.THRESH_BINARY)

## detect contours
contours, _ = cv2.findContours(imgBinThres, cv2.RETR_TREE, cv2.CHAIN_APPROX_SIMPLE)

#we get some letter parameter
averageLetterWidth, averageLetterHigh = calcAverageContourWithAndHeigh(contours)
threshold1AllowedLetterSizeOffset =   averageLetterHigh * 2  # double size
averageContourAreaSizeOfMinRect = calcAverageContourArea(contours)
threshHold2MinArea = 4 * averageContourAreaSizeOfMinRect / 5 # 4/5 * mean

print("mean letter Width: ", averageLetterWidth)
print("mean letter High: ", averageLetterHigh)
print("threshold 1 tolerance: ", threshold1AllowedLetterSizeOffset)
print("mean letter area ", averageContourAreaSizeOfMinRect)
print("thresold 2 min letter area ", threshHold2MinArea)

#we get all centroid of letter sizes contours, the other we ignore
centroidList = getCentroidWhenSizeInRange(contours,averageLetterWidth,averageLetterHigh,threshold1AllowedLetterSizeOffset,threshHold2MinArea)

if DEBUGMODE:
    #debug print all centers:
    imgFilteredCenter = img.copy()
    for cX,cY in centroidList:
        #draw in red color as  BGR
        cv2.circle(imgFilteredCenter, (cX, cY), 5, (0, 0, 255), -1)
    cv2.imwrite("img01letterCenters.jpg",resizeImageByPercentage(imgFilteredCenter,30))
    cv2.imshow("letterCenters",imgFilteredCenter)

#we estimate a bin widths
amountPixelFreeSpace = averageLetterHigh #TODO get better estimate out of histogram
estimatedBinWidth = round( averageLetterHigh + amountPixelFreeSpace) #TODO round better ?
binCollection = dict() #range(0,imgHeigh,estimatedBinWidth)

#we do seperate the center points into bins by y coordinate
for i in range(0,imgHeigh,estimatedBinWidth):
    listCenterPointsInBin = list()
    yMin = i
    yMax = i + estimatedBinWidth
    for cX,cY in centroidList:
        if yMin < cY < yMax:#if fits in bin
            listCenterPointsInBin.append((cX,cY))

    binCollection[i] = listCenterPointsInBin

#we assume all point are in one line ?
#model = slope (x) + intercept
#model = m (x) + n
mList = list() #slope abs in img
nList = list() #intercept abs in img
nListRelative = list() #intercept relative to bin start
minAmountRegressionElements = 12 #is also alias for letter amount we expect
#we do regression for every point in the bin
for startYOfBin, values in binCollection.items():
    #we reform values
    xValues = [] #TODO use more short transform
    yValues = []
    for x,y in values:
        xValues.append(x)
        yValues.append(y)

    #we assume a min limit of point in bin
    if len(xValues) >= minAmountRegressionElements :
        slope, intercept, r, p, std_err = stats.linregress(xValues, yValues)
        mList.append(slope)
        nList.append(intercept)
        #we calc the relative intercept
        nRelativeToBinStart = intercept - startYOfBin
        nListRelative.append(nRelativeToBinStart)

if DEBUGMODE:
    #we debug print all lines in one picute
    imgLines = img.copy()
    colorOfLine = (0, 255, 0) #green
    for i in range(0,len(mList)):
        slope = mList[i]
        intercept = nList[i]
        startPoint = (0, int( intercept)) #better round ?
        endPointY = int( (slope * imgWidth + intercept) )
        if endPointY < 0:
            endPointY = 0
        endPoint = (imgHeigh,endPointY)
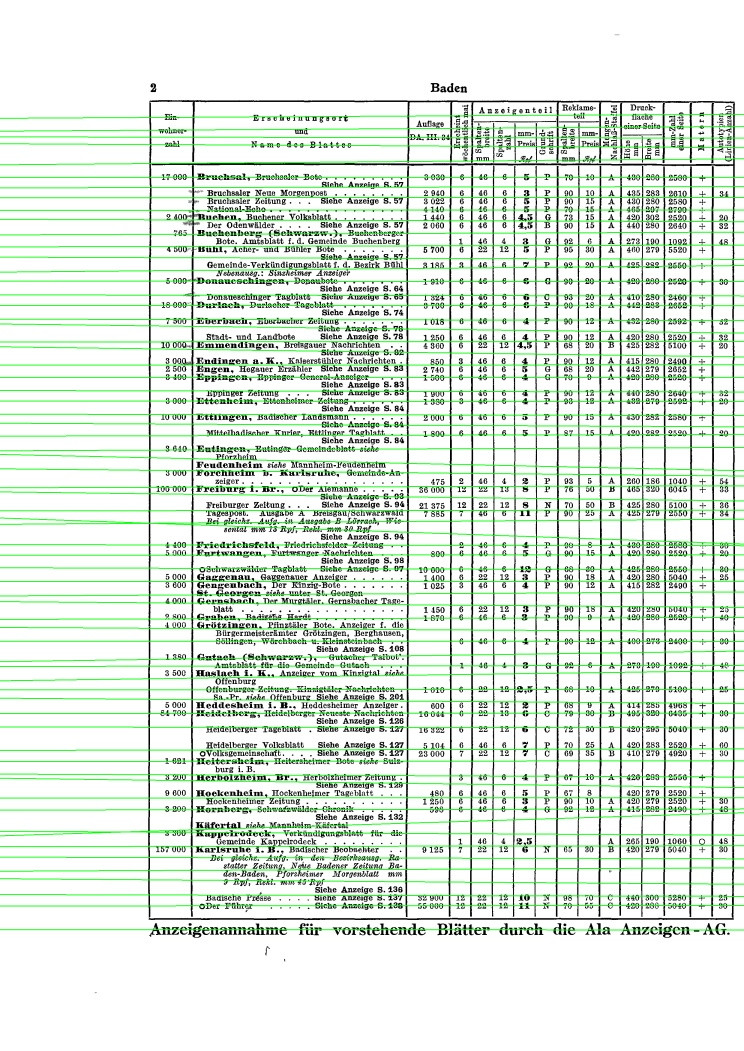
        cv2.line(imgLines, startPoint, endPoint, colorOfLine, 2)

    cv2.imwrite("img02lines.jpg",resizeImageByPercentage(imgLines,30))
    cv2.imshow("linesOfLetters ",imgLines)

#we assume in mean we got it right
meanIntercept = np.mean(nListRelative)
meanSlope = np.mean(mList)
print("meanIntercept :", meanIntercept)
print("meanSlope ", meanSlope)

#TODO calc angle with math.atan(slope) ...

if DEBUGMODE:
    cv2.waitKey(0)
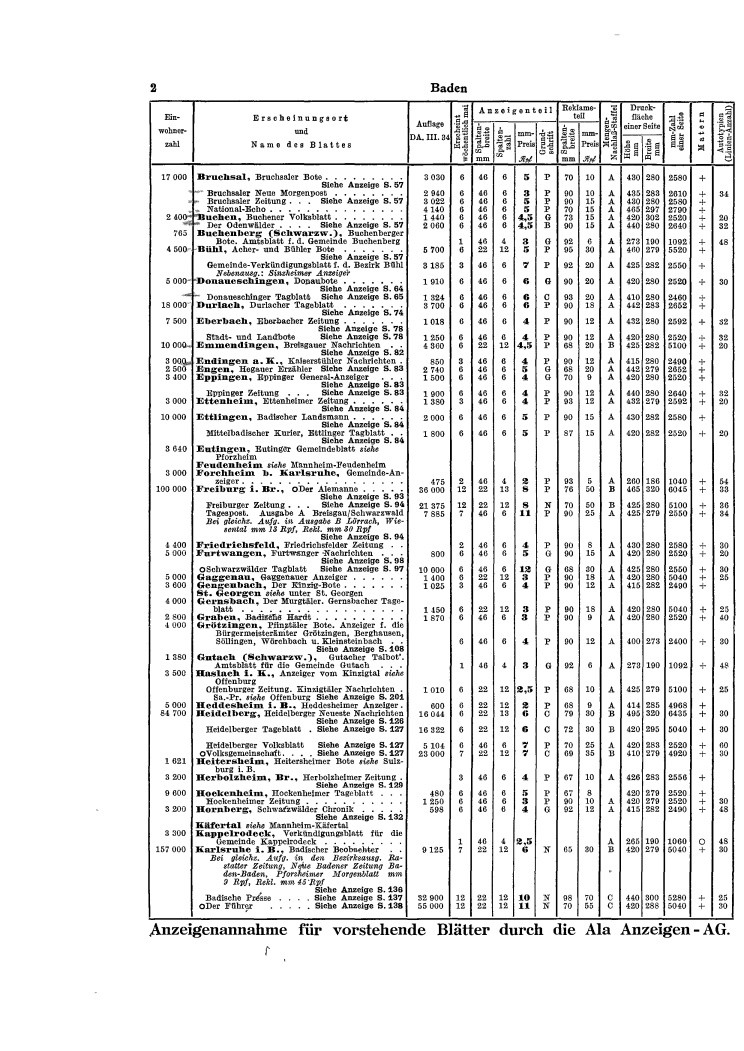
original:
![original pic]() center point of letters:
center point of letters:
![letter centers]() lines:
lines:
![lines]()


