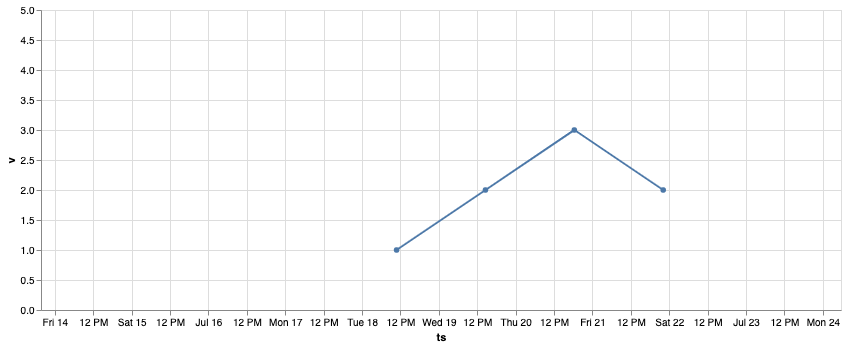
I'm making time series charts with Vega-Lite and I want to set the min and max values of the x-axis independent of the values that are being displayed. The reason is that I'm displaying multiple time series side by side in separate charts, and I want their x-axes to line up even when some series begin earlier than others.
I've found encoding.x.scale.domain, which seems like it's the right property to use. The documentation says that for temporal fields this should be a two element array of timestamps. However, it does not seem to matter what I set it to, my chart does not render any line, nor any ticks on the x-axis, and the warning Infinite extent for field "data": [Infinity, -Infinity]" is printed in the console.
Even more confusing is that I've been able to control the y-axis by setting encoding.y.scale.domain in the same way.
The following is a simplified version of the chart spec that I have experimented with in the Vega Editor. I'm trying to set the x-axis to start at an earlier point in time and end at a later point in time than the actual values:
{
  "$schema": "https://vega.github.io/schema/vega-lite/v4.json",
  "data": {
    "values": [
      {"ts": 1500400000000, "v": 1},
      {"ts": 1500500000000, "v": 2},
      {"ts": 1500600000000, "v": 3},
      {"ts": 1500700000000, "v": 2}
    ]
  },
  "width": 800,
  "height": 300,
  "mark": {"type": "line"},
  "encoding": {
    "x": {"field": "ts", "type": "temporal", "scale": {"domain": [1500000000000, 1500900000000]}},
    "y": {"field": "v", "type": "quantitative", "scale": {"domain": [0, 5]}}
  }
}
If I remove the encoding.x.scale.domain property it renders a line, but when including it I can't figure out any values that don't result in the warning.
Is this even the right way to set the min and max of the x-axis? Why does it work for the y-axis but not x-axis? What's the right way to do this?

