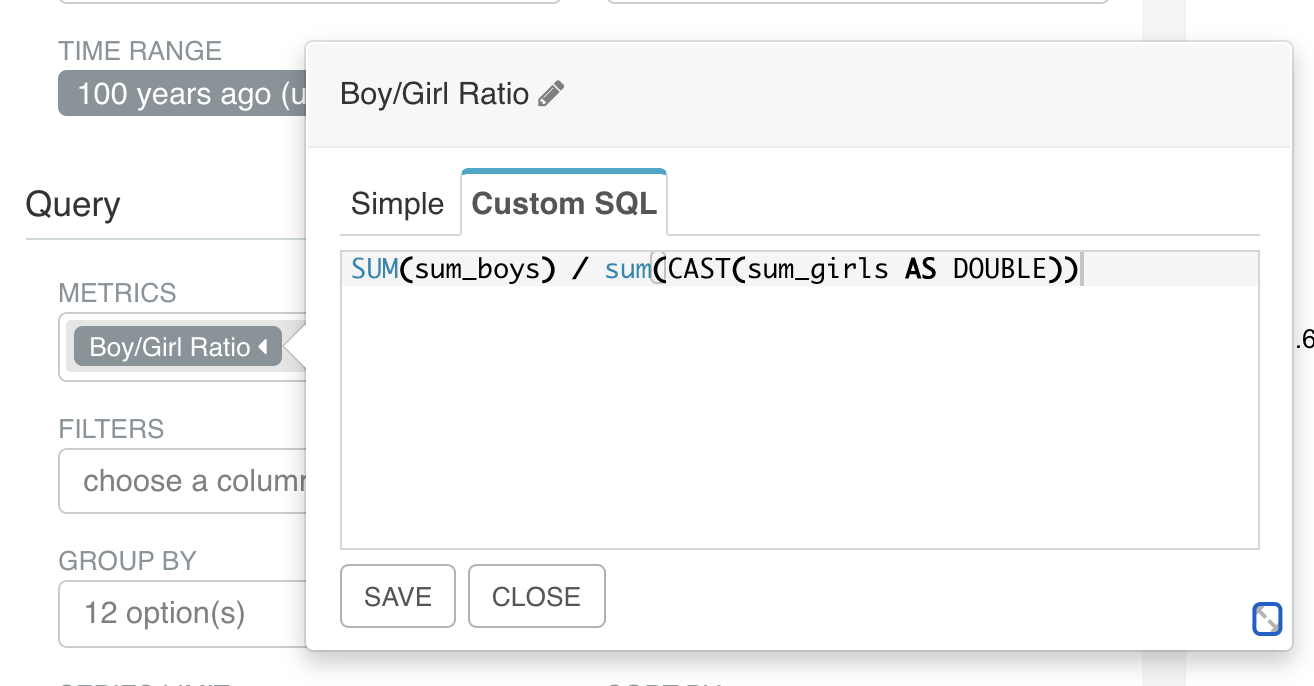
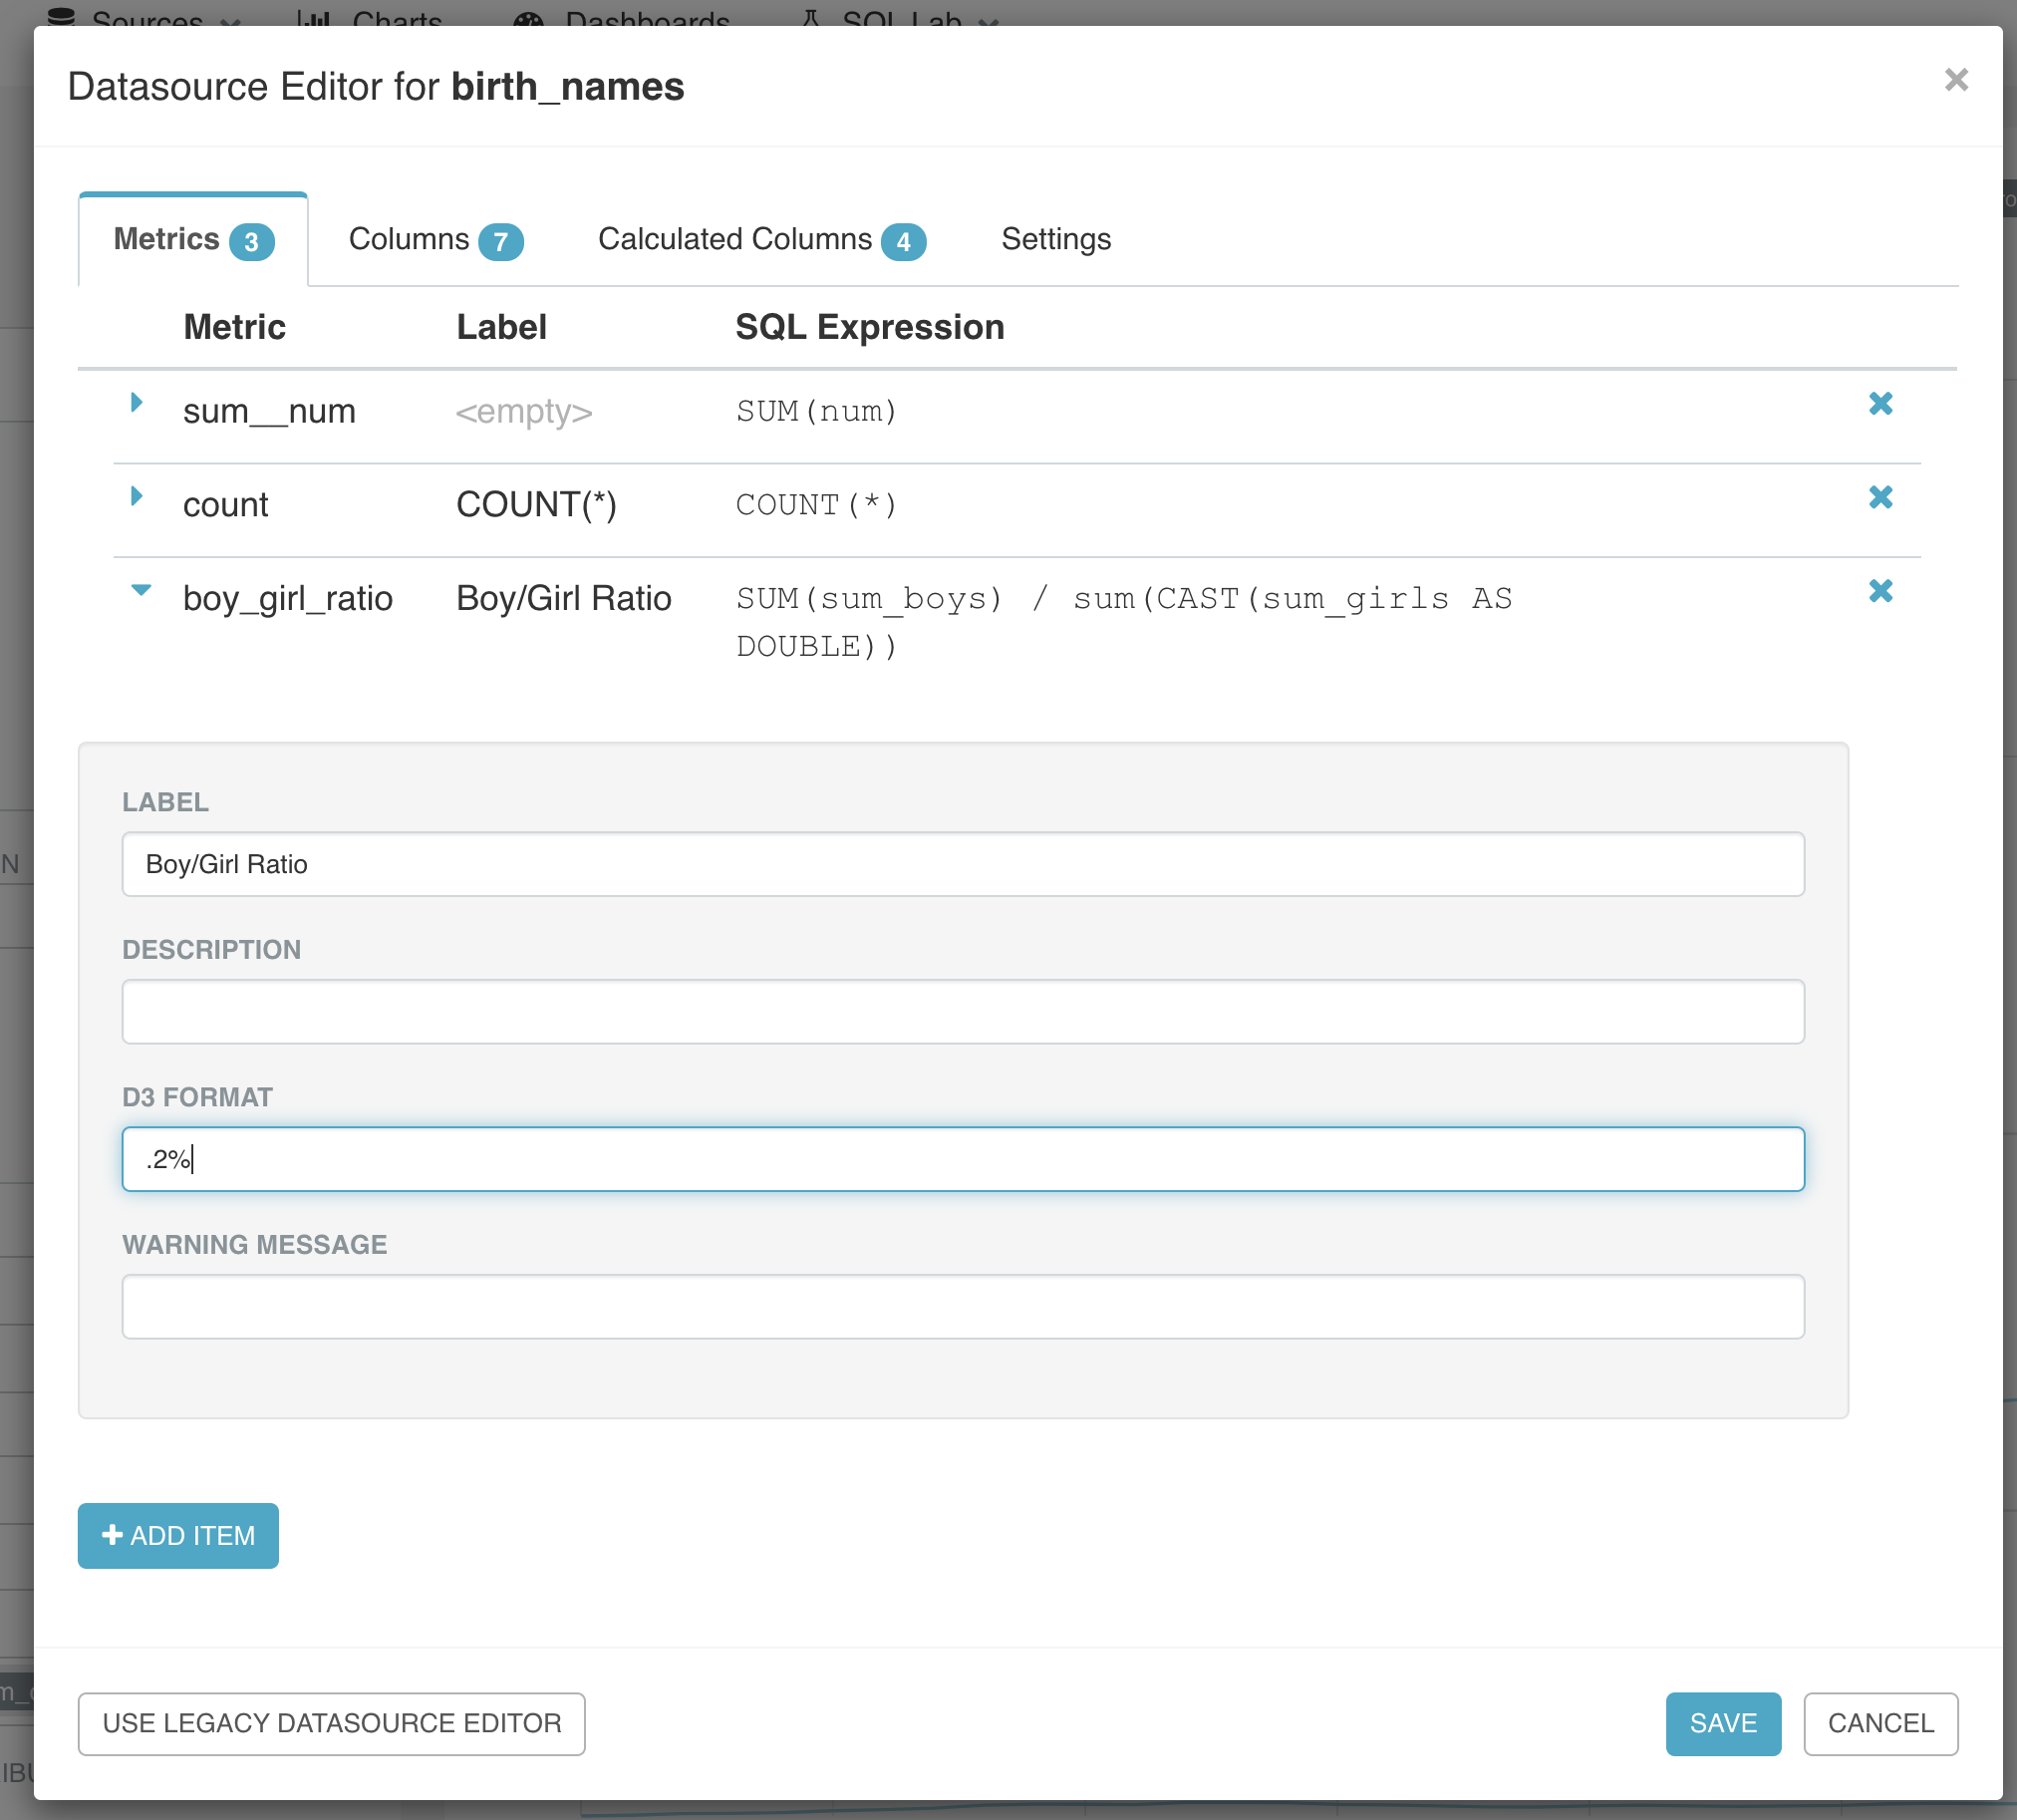
I'm trying to use Apache Superset to create a dashboard that will display the average rate of X/Y at different entities such that the time grain can be changed on the fly. However, all I have available as raw data is daily totals of X and Y for the entities in question.
It would be simple to do if I could just get a line chart that displayed sum(X)/sum(Y) as its own metric, where the sum range would change with the time grain, but that doesn't seem to be supported.
Creating a function in SQLAlchemy that calculates the daily rates and then uses that as the raw data is also an insufficient solution, since taking the average of that over different time ranges would not be properly weighted.
Is there a workaround I'm not seeing? Is there a way to use Druid or some other tool to make displaying a quotient over a variable range possible?
My current best solution is to just set up different charts for each time grain size (day, month, quarter, year), but that's extremely inelegant and I'm hoping to do better.


