Plotting networkx.Graph: how to change node position instead of resetting every node?
Asked Answered
A

1

7

I'm working on a project where I need to create a preview of nx.Graph() which allows to change position of nodes dragging them with a mouse. My current code is able to redraw whole figure immediately after each motion of mouse if it's clicked on specific node. However, this increases latency significantly. How can I update only artists needed, it is, clicked node, its label text and adjacent edges instead of refreshing every artist of plt.subplots()? Can I at least get a reference to all the artists that need to be relocated?

I started from a standard way of displaying a graph in networkx:

import networkx as nx
import matplotlib.pyplot as plt
import numpy as np
import scipy.spatial

def refresh(G):
    plt.axis((-4, 4, -1, 3))
    nx.draw_networkx_labels(G, pos = nx.get_node_attributes(G, 'pos'),
                                bbox = dict(fc="lightgreen", ec="black", boxstyle="square", lw=3))
    nx.draw_networkx_edges(G, pos = nx.get_node_attributes(G, 'pos'), width=1.0, alpha=0.5)
    plt.show()

nodes = np.array(['A', 'B', 'C', 'D', 'E', 'F', 'G'])
edges = np.array([['A', 'B'], ['A', 'C'], ['B', 'D'], ['B', 'E'], ['C', 'F'], ['C', 'G']])
pos = np.array([[0, 0], [-2, 1], [2, 1], [-3, 2], [-1, 2], [1, 2], [3, 2]])

G = nx.Graph()
# IG = InteractiveGraph(G) #>>>>> add this line in the next step
G.add_nodes_from(nodes)
G.add_edges_from(edges)
nx.set_node_attributes(G, dict(zip(G.nodes(), pos.astype(float))), 'pos')

fig, ax = plt.subplots()
# fig.canvas.mpl_connect('button_press_event', lambda event: IG.on_press(event))
# fig.canvas.mpl_connect('motion_notify_event', lambda event: IG.on_motion(event))
# fig.canvas.mpl_connect('button_release_event', lambda event: IG.on_release(event))
refresh(G) # >>>>> replace it with IG.refresh() in the next step

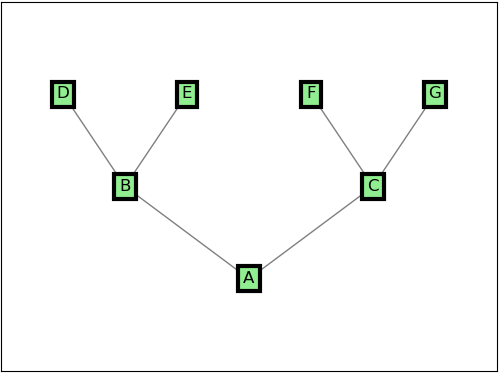
enter image description here

In the next step I changed 5 line of previous script (4 is uncommented and 1 replaced) plus used InteractiveGraph instance to make it interactive:

class InteractiveGraph:
    def __init__(self, G, node_pressed=None, xydata=None):
        self.G = G
        self.node_pressed = node_pressed
        self.xydata = xydata

    def refresh(self, show=True):
        plt.clf()
        nx.draw_networkx_labels(self.G, pos = nx.get_node_attributes(self.G, 'pos'),
                                bbox = dict(fc="lightgreen", ec="black", boxstyle="square", lw=3))
        nx.draw_networkx_edges(self.G, pos = nx.get_node_attributes(self.G, 'pos'), width=1.0, alpha=0.5)
        plt.axis('off')
        plt.axis((-4, 4, -1, 3))
        fig.patch.set_facecolor('white')
        if show:
            plt.show()

    def on_press(self, event):
        if event.inaxes is not None and len(self.G.nodes()) > 0:
            nodelist, coords = zip(*nx.get_node_attributes(self.G, 'pos').items())
            kdtree = scipy.spatial.KDTree(coords)
            self.xydata = np.array([event.xdata, event.ydata])
            close_idx = kdtree.query_ball_point(self.xydata, np.sqrt(0.1))
            i = close_idx[0]
            self.node_pressed = nodelist[i]

    def on_motion(self, event):
        if event.inaxes is not None and self.node_pressed:
            new_xydata = np.array([event.xdata, event.ydata])
            self.xydata += new_xydata - self.xydata
            #print(d_xy, self.G.nodes[self.node_pressed])
            self.G.nodes[self.node_pressed]['pos'] = self.xydata
            self.refresh(show=False)
            event.canvas.draw()

    def on_release(self, event):
        self.node_pressed = None

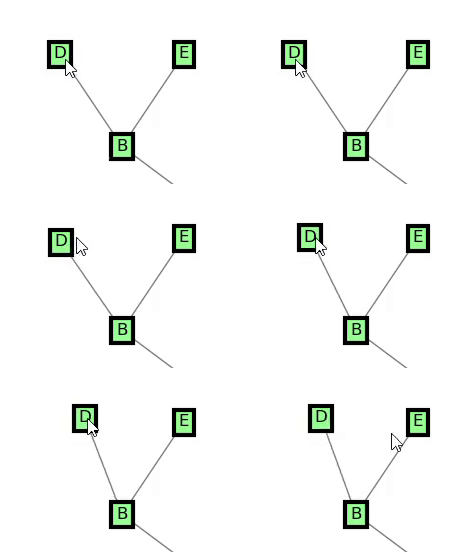
enter image description here

Related sources:

Arp answered 10/9, 2020 at 21:44 Comment(9)
Do you need to use matplotlib? If you are in an environment where jupyter widgets are supported (notebooks, lab, voila) then you can use ipycytoscape.readthedocs.io/en/latest which will give you interactivity for free. It supports creation directly from networkx objectsBushelman
Also in general for animating matplotlib if you're able to access the underlying objects many of them will have a set_data method that you can call to update just that artist, this will allow for significant performance improvements.Bushelman
Yes, it's preferable. I would like to add my custom functionality such as displaying of directed arrows going to midpoints of other edges (or, actually, hidden nodes that corresponds to midpoints these edges), interactive deletion and creation of nodes and edges and manual insertions of label text. These were the main funcionalities that gave me a decision to use matplotlib. Other options are also welcomeArp
I think all of those should already be possible in ipycytoscape, and if they aren't then they definitely should be implemented. (Disclaimer: I've contributed heavily to ipycytoscape)Bushelman
I think the biggest drawback of ipycytoscape is that you would be forced into displaying only in a notebookBushelman
I'm using Pycharm for this project but I'm experienced user of Jupyter Notebooks as well. Ok @lanhi I'll try to learn more about ipycytoscape and thanks a lot for reference. I may post a solution if it satisfies my needs.Arp
Sounds good. If you encounter any issues don't hesitate to open an issue on github: github.com/QuantStack/ipycytoscapeBushelman
I'm opening bounty in next 3 hours because I think this is one of essential problems that arises when trying to introduce event handling into plot of networkx objects. Feel free to answer.Arp
I have implemented the logic for interactive graphs in netgraph, which started out as a fork of the networkx plotting tools. Fast interactive drawing was one of my motivators for the rewrite. Using plain networkx is a bit difficult because the drawing functions do not expose the artists, so you can't make use of matplotlib's API' to change artists properties without re-instantiating the artist (set_data, set_xy etc.). The relevant part of the code starts here.Rotherham
R
4

To expand on my comment above, in netgraph, your example can be reproduced with

import numpy as np
import matplotlib.pyplot as plt; plt.ion()
import networkx as nx
import netgraph

nodes = np.array(['A', 'B', 'C', 'D', 'E', 'F', 'G'])
edges = np.array([['A', 'B'], ['A', 'C'], ['B', 'D'], ['B', 'E'], ['C', 'F'], ['C', 'G']])
pos = np.array([[0, 0], [-2, 1], [2, 1], [-3, 2], [-1, 2], [1, 2], [3, 2]])

G = nx.Graph()
G.add_nodes_from(nodes)
G.add_edges_from(edges)

I = netgraph.InteractiveGraph(G,
                              node_positions=dict(zip(nodes, pos)),
                              node_labels=dict(zip(nodes,nodes)),
                              node_label_bbox=dict(fc="lightgreen", ec="black", boxstyle="square", lw=3),
                              node_size=12,
)

# move stuff with mouse

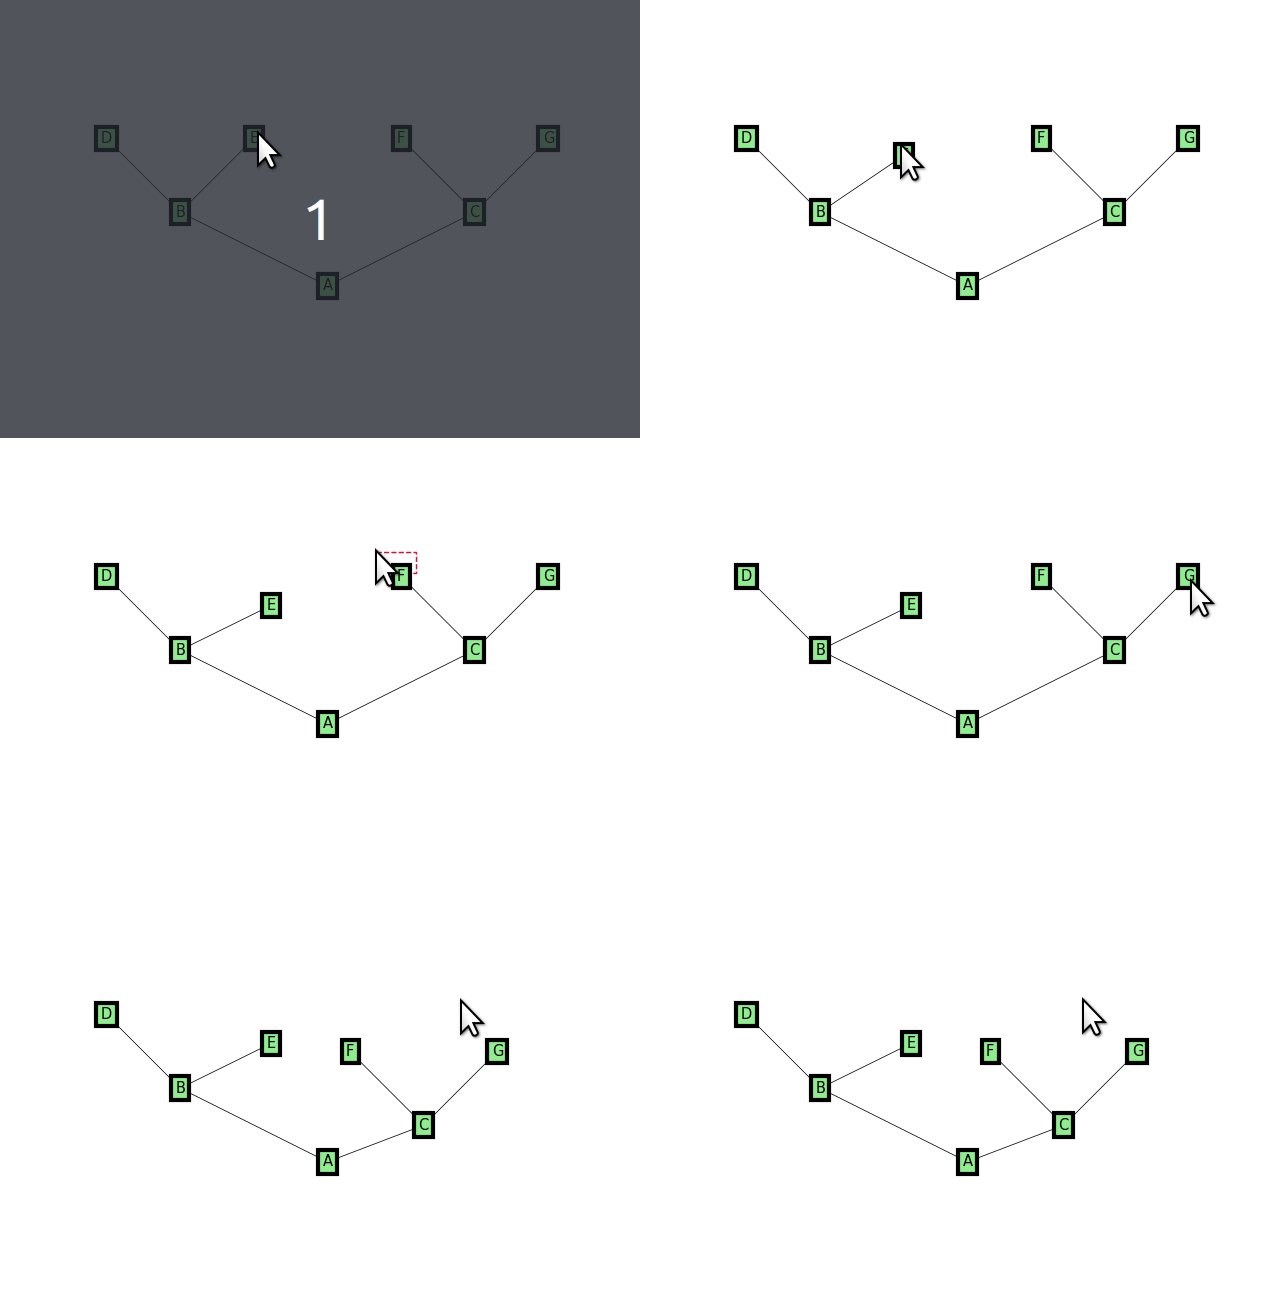
enter image description here


Regarding the code you wrote, the kd-tree is unnecessary if you have handles of all the artists. In general, matplotlib artists have a contains method, such that when you log button press events, you can simply check artist.contains(event) to find out if the button press occurred over the artist. Of course, if you use networkx to do the plotting, you can't get the handles in a nice, query-able form (ax.get_children() is neither) so that is not possible.

Rotherham answered 14/9, 2020 at 15:18 Comment(3)
Thanks for response, Paul. This is useful.Arp
@Arp Let me know if this works for you or what your pain points are. I am rewriting some part of the code base (mostly internals to make some other features easier to write) and am happy to take any suggestions on board. Also, if you are interested in writing stuff like this, then I would be happy to collaborate.Rotherham
I was doing a small project that allows to draw schemas of mathematical proofs. After 5 days of scripting I ended up with quite satisfactory version. Thanks for example you share, I have tested it. This is a really nice reference to improve my script. Unfortunately, my project is stuck to old version at the moment but hopefully I'll find a time to replace all the nx.Graphs with netgraph.InteractiveGraphs when I'll get back.Arp

© 2022 - 2024 — McMap. All rights reserved.