Find minimum and maximum values in OHLC data
Asked Answered
R

3

7

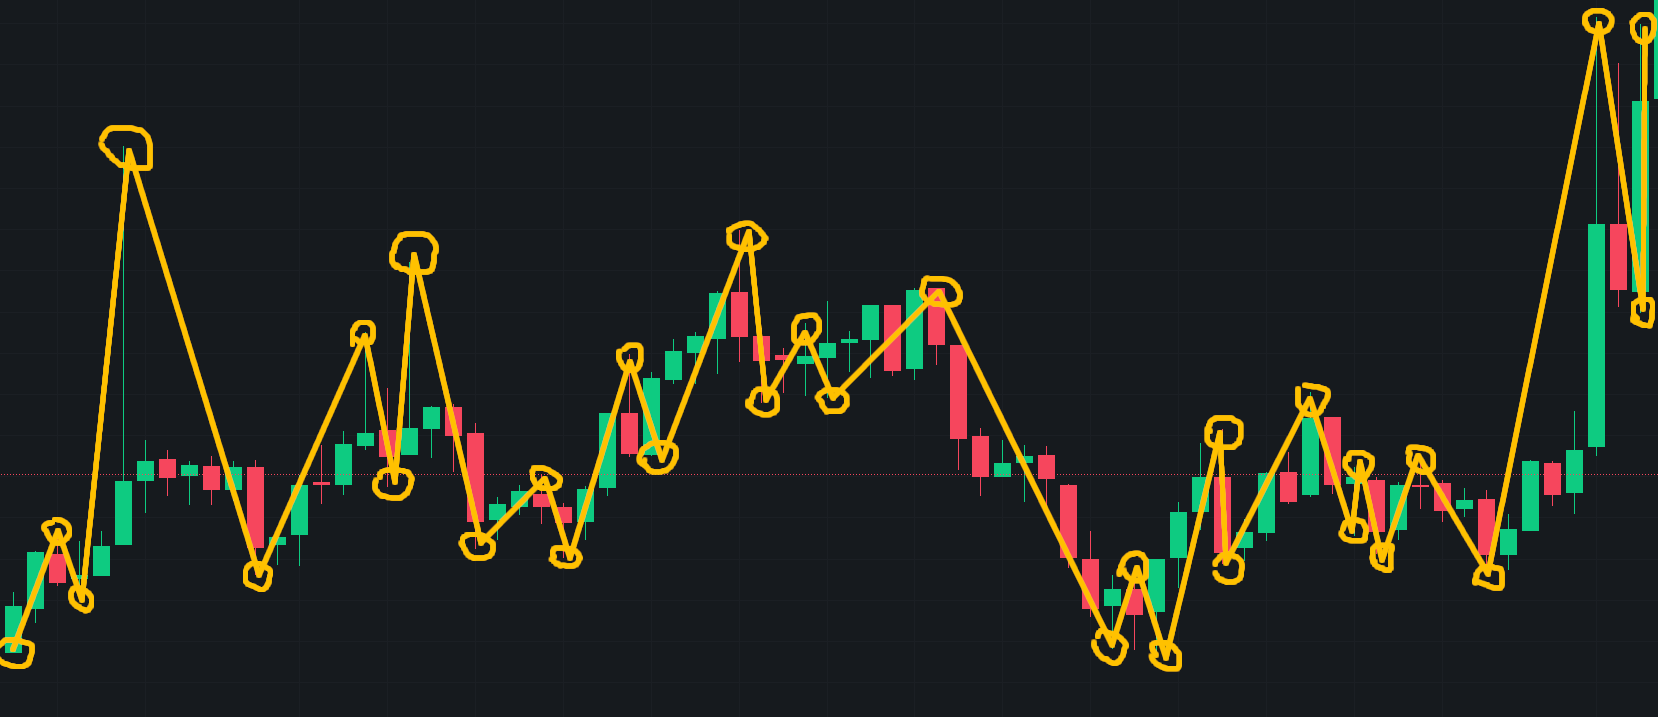
I would like to find (in python) the local minimum and maximum values in OHLC data, under the condition that the distance between these values is at least +-5%.

Temporal Condition

Note that

  • for an UP movement (close>open), low price comes BEFORE high price
  • for a DOWN movement (close<open), low price comes AFTER high price

The best way to explain what I would like to achieve is by a graphical example:

enter image description here

OHLC data is in this format:

open_time      open        high        low         close
2023-07-02  0.12800000  0.12800000  0.12090000  0.12390000
2023-07-03  0.12360000  0.13050000  0.12220000  0.12830000
2023-07-04  0.12830000  0.12830000  0.12320000  0.12410000
2023-07-05  0.12410000  0.12530000  0.11800000  0.11980000
2023-07-06  0.11990000  0.12270000  0.11470000  0.11500000

The result should be something like:

date1 val1 date2 val2 <---up
date2 val2 date3 val3 <---down
date3 val3 date4 val4 <---up
date4 val4 date5 val5 <---down
.
.
.

As for the data in the example the result should be:

2023-07-02  0.1280  2023-07-02  0.1209  -5.55%
2023-07-02  0.1209  2023-07-03  0.1305  7.94%
2023-07-03  0.1305  2023-07-06  0.1147  -12.11%

Is there a name for this task?


ADDENDUM

I add a new example, with a different condition (+-3%).

This is the data:

2022-02-25  38340.4200  39699.0000  38038.4600  39237.0600
2022-02-26  39237.0700  40300.0000  38600.4600  39138.1100
2022-02-27  39138.1100  39881.7700  37027.5500  37714.4300
2022-02-28  37714.4200  44200.0000  37468.2800  43181.2700
2022-03-01  43176.4100  44968.1300  42838.6800  44434.0900

And the final result shold be:

2022-02-25  38038   2022-02-26  40300   5.95%
2022-02-26  40300   2022-02-26  38600   -4.22%
2022-02-26  38600   2022-02-27  39881   3.32%
2022-02-27  39881   2022-02-27  37027   -7.16%
2022-02-27  37027   2022-02-28  44200   19.37%
2022-02-28  44200   2022-03-01  42838   -3.08%

Rehnberg answered 6/7, 2023 at 13:20 Comment(6)
What have you attempted? How is the ohlc data formatted?Lefthand
@JonathanF. Added OHLC data and desired result.Rehnberg
I guess I don't understand what val2, val3, etc. are. Nor do I understand your results; you skip from 7/3 to 7/6, but the data has 7/4 and 7/5 in it.Porkpie
@Porkpie val1 is the minimum of date1, val2 is the maximum of date2, val3 is the minimum of date3, and so on. Results include the series of ups and downs where the distance between them is +/-5%.Rehnberg
On the second line of your example, why is the high entry used? Isn't it a problem that the low value might have come before the high?Mancy
I don't really understand the output, on your addendum, why do you include the pair "2022-02-26", "2022-02-26" and if you are including the data on the same date, why would you not include the pair "2022-02-28", "2022-02-28" I though you wanted highs and lows like the ones on this picture imgur.com/DxPfhALEndoenzyme
M
3

This is a straightforward solution by splitting each daily OHLC line into four (day, value) entries. Then we process each entry (order dependent on direction) while recording the local minima/maxima ("peaks"), merging continuous runs and skipping insignificant movements.

There are two NamedTuple's: Entry (for a (day, value) pair) and Movement (for each line of the results). I could have used tuples, but NamedTuple's give clear names for each field.

It also doesn't depend on numpy, pandas, or any other library, and the type hints help catch mistakes at compile time if used with a static checker like mypy. It should also be fairly fast for a pure-Python solution, as it computes all movements in one pass.

from typing import Iterator, NamedTuple

Entry = NamedTuple('Entry', [('value', float), ('date', str)])
Movement = NamedTuple('Movement', [('start', Entry), ('end', Entry), ('percentage', float)])
get_change = lambda a, b: (b.value - a.value) / a.value

def get_movements(data_str: str, min_change_percent: float = 0.05) -> Iterator[Movement]:
    """ Return all movements with changes above a threshold. """
    peaks: list[Entry] = []
    for line in data_str.strip().split('\n'):
        # Read lines from input and split into date and values.
        date, open, high, low, close = line.split()
        # Order values according to movement direction.
        values_str = [open, low, high, close] if close > open else [open, high, low, close]
        for value_str in values_str:
            entry = Entry(float(value_str), date)
            if len(peaks) >= 2 and (entry > peaks[-1]) == (peaks[-1] > peaks[-2]):
                # Continue movement of same direction by replacing last peak.
                peaks[-1] = entry
            elif not peaks or abs(get_change(peaks[-1], entry)) >= min_change_percent:
                # New peak is above minimum threshold.
                peaks.append(entry)

    # Convert every pair of remaining peaks to a `Movement`.
    for start, end in zip(peaks, peaks[1:]):
        yield Movement(start, end, percentage=get_change(start, end))

Usage for first example:

data_str = """
2023-07-02  0.12800000  0.12800000  0.12090000  0.12390000
2023-07-03  0.12360000  0.13050000  0.12220000  0.12830000
2023-07-04  0.12830000  0.12830000  0.12320000  0.12410000
2023-07-05  0.12410000  0.12530000  0.11800000  0.11980000
2023-07-06  0.11990000  0.12270000  0.11470000  0.11500000
"""

for mov in get_movements(data_str, 0.05):
    print(f'{mov.start.date}  {mov.start.value:.4f}  {mov.end.date}  {mov.end.value:.4f}  {mov.percentage:.2%}')
# 2023-07-02  0.1280  2023-07-02  0.1209  -5.55%
# 2023-07-02  0.1209  2023-07-03  0.1305  7.94%
# 2023-07-03  0.1305  2023-07-06  0.1147  -12.11%

Usage for second example:

data_str = """
2022-02-25  38340.4200  39699.0000  38038.4600  39237.0600
2022-02-26  39237.0700  40300.0000  38600.4600  39138.1100
2022-02-27  39138.1100  39881.7700  37027.5500  37714.4300
2022-02-28  37714.4200  44200.0000  37468.2800  43181.2700
2022-03-01  43176.4100  44968.1300  42838.6800  44434.0900
"""

for mov in get_movements(data_str, 0.03):
    print(f'{mov.start.date}  {int(mov.start.value)}  {mov.end.date}  {int(mov.end.value)}  {mov.percentage:.2%}')
# 2022-02-25  38340  2022-02-26  40300  5.11%
# 2022-02-26  40300  2022-02-26  38600  -4.22%
# 2022-02-26  38600  2022-02-27  39881  3.32%
# 2022-02-27  39881  2022-02-27  37027  -7.16%
# 2022-02-27  37027  2022-02-28  44200  19.37%
# 2022-02-28  44200  2022-03-01  42838  -3.08%
# 2022-03-01  42838  2022-03-01  44968  4.97%

The first result of the second example doesn't agree with the value you provided, but it's not clear to me why it started at 38038 instead of 38340. All other values match perfectly.

Mancy answered 8/7, 2023 at 16:41 Comment(3)
It seems there is some problems with your results. I added a new example with the condition +-3%. Please, read my note. Thanks.Rehnberg
Please, see my update about temporal conditions.Rehnberg
@Rehnberg Alright, tenth time's the charm. I changed the order the values are processed based on movement direction. I spent way too long at this, but I have to say, it's a fun puzzle.Mancy
I
1

I sat out determined to give this a go with using as much pandas as possible. I couldn't figure out a better way than @BoppreH to actually implement the business logic of the peak determination. I create a configurable filter to be applied to the rows of the DataFrame with a decorator for state storage:

def min_percent_change_filter(min_change_percent=0.05):
    peaks = []
    get_change = lambda a, b: (b - a) / a

    def add_entry(row):
        """By @BoppreH, with slight modifications
        Update list of peaks with one new entry."""
        if len(peaks) >= 2 and (row["data"] > peaks[-1]["data"]) == (
            peaks[-1]["data"] > peaks[-2]["data"]
        ):
            # Continue movement of same direction by replacing last peak.
            peaks[-1] = row.copy()
            return peaks
        elif (
            not peaks
            or abs(get_change(peaks[-1]["data"], row["data"])) >= min_change_percent
        ):
            # New peak is above minimum threshold.
            peaks.append(row.copy())
            return peaks
        return peaks

    return add_entry

The pandas part requires quite some manipulation to get the data into the right shape. After it's in the right shape, we apply the filter across rows. Finally we put the DataFrame in the desired output format:

import pandas as pd


def pandas_approach(data, min_pct_change):
    df = pd.DataFrame(data)
    df["open_time"] = pd.to_datetime(df["open_time"])

    # Respect termporal aspect, create new columns first and second
    # set them to the respective value depending on whether we're
    # moving down or up
    df["first"] = df["low"].where(df["open"] <= df["close"], df["high"])
    df["second"] = df["high"].where(df["open"] <= df["close"], df["low"])

    # Create a new representation of the data, by stacking first and second
    # on the index, then sorting by 'open_time' and whether it came first
    # or second (Note: assert 'first' < 'second')
    stacked_representation = (
        df.set_index("open_time")[["first", "second"]]
        .stack()
        .reset_index()
        .sort_values(["open_time", "level_1"])[["open_time", 0]]
    )
    stacked_representation.columns = ["open_time", "data"]

    # Now we can go to work with our filter
    results = pd.DataFrame(
        stacked_representation.apply(min_percent_change_filter(min_pct_change), axis=1)[
            0
        ]
    )
    # We reshape /rename/reorder our data to fit the desired output format
    results["begin"] = results["data"].shift()
    results["begin_date"] = results["open_time"].shift()
    results = results.dropna()[["begin_date", "begin", "open_time", "data"]]
    results.columns = ["begin_date", "begin", "end_date", "end"]

    # Lastly add the pct change
    results["pct_change"] = (results.end - results.begin) / results.begin
    # This returns the styler for output formatting purposes, but you can return the
    # DataFrame instead by commenting/deleting it

    def format_datetime(dt):
        return pd.to_datetime(dt).strftime("%Y-%m-%d")

    def price_formatter(value):
        return "{:.4f}".format(value) if abs(value) < 10000 else "{:.0f}".format(value)

    return results.style.format(
        {
            "pct_change": "{:,.2%}".format,
            "begin_date": format_datetime,
            "end_date": format_datetime,
            "begin": price_formatter,
            "end": price_formatter,
        }
    )

Output for the first example::


import pandas as pd

data = {
    "open_time": ["2023-07-02", "2023-07-03", "2023-07-04", "2023-07-05", "2023-07-06"],
    "open": [0.12800000, 0.12360000, 0.12830000, 0.12410000, 0.11990000],
    "high": [0.12800000, 0.13050000, 0.12830000, 0.12530000, 0.12270000],
    "low": [0.12090000, 0.12220000, 0.12320000, 0.11800000, 0.11470000],
    "close": [0.12390000, 0.12830000, 0.12410000, 0.11980000, 0.11500000],
}
pandas_approach(data,0.05)
    begin_date  begin   end_date    end     pct_change
1   2023-07-02  0.1280  2023-07-02  0.1209  -5.55%
3   2023-07-02  0.1209  2023-07-03  0.1305  7.94%
9   2023-07-03  0.1305  2023-07-06  0.1147  -12.11%

Output for the second example:

data_2 = {
    "open_time": ["2022-02-25", "2022-02-26", "2022-02-27", "2022-02-28", "2022-03-01"],
    "open": [38340.4200, 39237.0700, 39138.1100, 37714.4200, 43176.4100],
    "high": [39699.0000, 40300.0000, 39881.7700, 44200.0000, 44968.1300],
    "low": [38038.4600, 38600.4600, 37027.5500, 37468.2800, 42838.6800],
    "close": [39237.0600, 39138.1100, 37714.4300, 43181.2700, 44434.0900],
}
pandas_approach(data_2, 0.03)
    begin_date  begin   end_date    end     pct_change
2   2022-02-25  38038   2022-02-26  40300   5.95%
3   2022-02-26  40300   2022-02-26  38600   -4.22%
4   2022-02-26  38600   2022-02-27  39882   3.32%
5   2022-02-27  39882   2022-02-27  37028   -7.16%
7   2022-02-27  37028   2022-02-28  44200   19.37%
8   2022-02-28  44200   2022-03-01  42839   -3.08%
9   2022-03-01  42839   2022-03-01  44968   4.97%
Indispose answered 14/7, 2023 at 18:7 Comment(0)
S
0

Input: Pandas DataFrame with columns: Open, High, Low, Close.

Output: added two Boolean columns is_min. is_max.

Insignificant highs and lows are filtered out not by percentages, but based on the ATR (Average True Range) multiplied by some coefficient.

import pandas as pd

from utils.import_data import import_ohlc_daily        

ATR_SMOOTHING_N = 14
ATR_MULTIPLIER = 2.5


def add_atr_col_to_df(
    df: pd.DataFrame, n: int = 5, exponential: bool = False
) -> pd.DataFrame:
    """
    Add ATR (Average True Range) column to DataFrame.
    Average True Range is a volatility estimate.
    n - number of periods.
    If exponential is true,
    use ewm - exponentially weighted values,
    to give more weight to the recent data point.
    Otherwise, calculate simple moving average.
    """

    data = df.copy(deep=True)
    high = data["High"]
    low = data["Low"]
    close = data["Close"]
    data["tr0"] = abs(high - low)
    data["tr1"] = abs(high - close.shift())
    data["tr2"] = abs(low - close.shift())
    data["tr"] = data[["tr0", "tr1", "tr2"]].max(axis=1)
    
    if exponential:
        data[f"atr_{n}"] = (
            data["tr"].ewm(alpha=2 / (n + 1), min_periods=n, adjust=False).mean()
        )
    else:
        data[f"atr_{n}"] = data["tr"].rolling(window=n, min_periods=n).mean()

    del data["tr0"]
    del data["tr1"]
    del data["tr2"]
    # del data["tr"]
    return data


class MinMaxProcessor:
    def __init__(self, df: pd.DataFrame):
        self.df = df.copy()
        if not "is_min" in self.df.columns:
            self.df["is_min"] = False
        if not "is_max" in self.df.columns:
            self.df["is_max"] = False
        self.fill_is_min_max()

    def fill_is_min_max(self):
        """
        Process all rows and fill is_min and is_max columns in self.df
        """
        current_candidate = {
            "date": self.df.index[0],
            "close_price_val": self.df["Close"].iloc[0],
            "extremum_type": "max",  # this choice is arbitrary, could be min, doesn't matter
        }
        counter = 0
        total_count = self.df.shape[0]
        for i, row in self.df.iterrows():
            counter = counter + 1
            print(f"Iterating row {counter} of {total_count}...")
            
            # looking for max
            if current_candidate["extremum_type"] == "max":
                if row["Close"] >= current_candidate["close_price_val"]:
                    current_candidate["close_price_val"] = row["Close"]
                    current_candidate["date"] = i
                elif (current_candidate["close_price_val"] - row["Close"]) > (
                    row[f"atr_{ATR_SMOOTHING_N}"] * ATR_MULTIPLIER
                ):
                    self.df.loc[
                        self.df.index == current_candidate["date"], "is_max"
                    ] = True
                    current_candidate["extremum_type"] = "min"
                    current_candidate["date"] = i
                    current_candidate["close_price_val"] = row["Close"]

            else:  # looking for min, current_candidate['extremum_type'] == 'min'
                if row["Close"] <= current_candidate["close_price_val"]:
                    current_candidate["close_price_val"] = row["Close"]
                    current_candidate["date"] = i
                elif (row["Close"] - current_candidate["close_price_val"]) > (
                    row[f"atr_{ATR_SMOOTHING_N}"] * ATR_MULTIPLIER
                ):
                    self.df.loc[
                        self.df.index == current_candidate["date"], "is_min"
                    ] = True
                    current_candidate["extremum_type"] = "max"
                    current_candidate["date"] = i
                    current_candidate["close_price_val"] = row["Close"]


if __name__ == "__main__":

    ticker = "AAPL"

    # import daily OHLC data from somewhere
    res = import_ohlc_daily(ticker=ticker)  

    res = add_atr_col_to_df(df=res, n=ATR_SMOOTHING_N, exponential=False)
    aapl_processor = MinMaxProcessor(df=res)
    aapl_processor.df.to_excel(f"{ticker}_daily.xlsx")
Subantarctic answered 14/9, 2024 at 14:49 Comment(0)

© 2022 - 2025 — McMap. All rights reserved.