I'm investigating about a week for an interactive and high performance financial stock charts for an iPhone application "something like candlestick/OHLC charts for stock markets", I found CorePlot, which is open source and free, and ShinobiControls, which is very lightweight and perfect and paid, I was wondering if there other suggestions should I look upon?
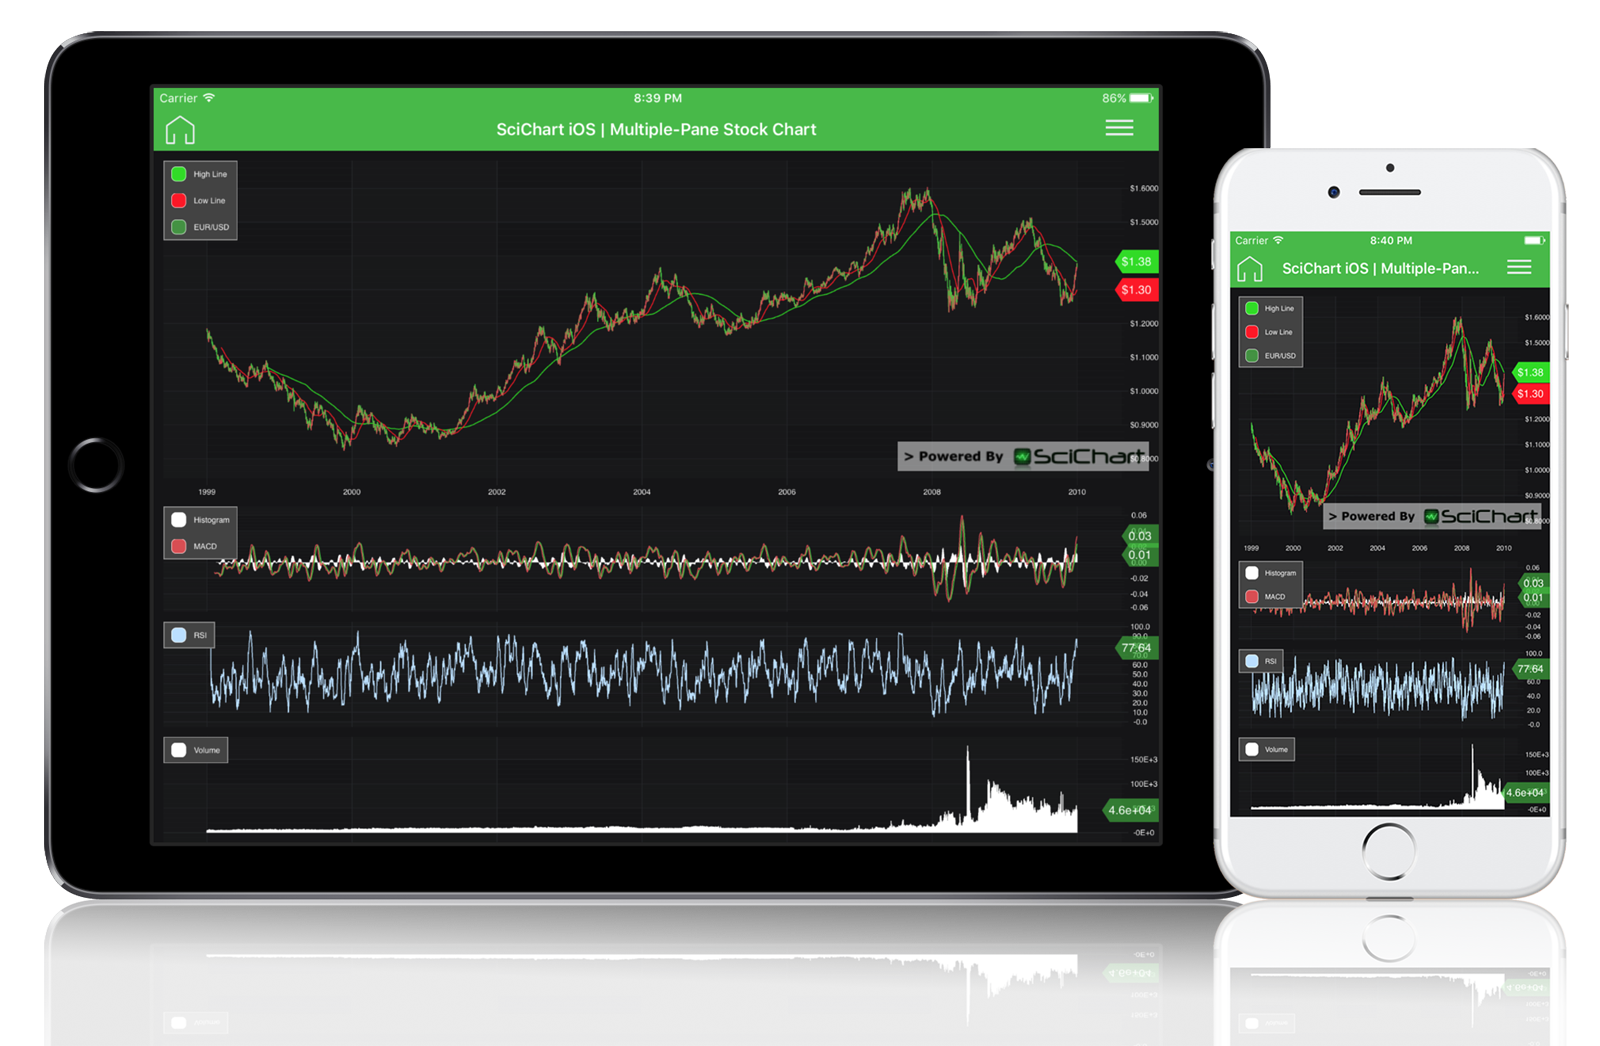
SciChart have released iOS Stock Charts as part of the SciChart iOS SDK.
SciChart iOS is a paid component and supports:
- Extreme performance for realtime charts beating all competitors in tests.
- Cross platform to Android, Xamarin, WPF
- Multi-pane synchronisation between charts (shares chart events, and zooming)
- CategoryDateTimeAxis (collapses weekend / overnight gaps for trading charts)
- Many series types to be able to render Candlesticks, OHLC, Mountains, Columns, Bands, Scatter points.
- Zooming, panning, scaling out of the box
- Axis Textformatting, customisation of axis label and axis frequency output
- Cursors, Tooltips
- Simple annotations e.g. Line, Text, Axis Marker
- Stylish dark theme out of the box!
You can now clone the iOS Chart examples on Github and have a play around with the controls and see how we created the above example app! Pretty soon we hope to have a demo available on the Apple store too.
Disclosure: I'm the MD of SciChart!
You can try, https://github.com/honcheng/iOSPlot/tree/master/iOSPlot . Also, if you want to get your hands dirty a bit if you don't know JS, you can try http://g.raphaeljs.com/ which has some great charts. Accept this answer if you feel as though it met your needs, thanks.
Have you ever tried Fusion Charts?
It's the best charting library I've seen. I've used them for web projects and iOS projects as well since they have now JS versions of everything.
Pretty complex graphics, wide range of charts, and even real-time widgets which can fit your particular needs for this project.
They're not free but totally worth it to consider. I've done everything related to pilots and demo projects with the trial version.
Check them out at http://www.fusioncharts.com/demos/gallery/
Infragistics has entered the iOS components market. Check http://www.infragistics.com/iOS. Infragistics is also a lot cheaper than Shinobi. It does support Candlestick & OHLC financial series and has financial indicators & trendlines built in too.
They have a grid and charts. It's currently in public beta but you can download it for free for now.
You can also read the FAQ at http://community.infragistics.com/blogs/nick-landry/archive/2012/06/11/netadvantage-for-ios-public-beta-now-available-for-download-with-bonus-faq.aspx.
Disclaimer: I'm the Product Manager for all mobile products at Infragistics.
SciChart have released iOS Stock Charts as part of the SciChart iOS SDK.
SciChart iOS is a paid component and supports:
- Extreme performance for realtime charts beating all competitors in tests.
- Cross platform to Android, Xamarin, WPF
- Multi-pane synchronisation between charts (shares chart events, and zooming)
- CategoryDateTimeAxis (collapses weekend / overnight gaps for trading charts)
- Many series types to be able to render Candlesticks, OHLC, Mountains, Columns, Bands, Scatter points.
- Zooming, panning, scaling out of the box
- Axis Textformatting, customisation of axis label and axis frequency output
- Cursors, Tooltips
- Simple annotations e.g. Line, Text, Axis Marker
- Stylish dark theme out of the box!
You can now clone the iOS Chart examples on Github and have a play around with the controls and see how we created the above example app! Pretty soon we hope to have a demo available on the Apple store too.
Disclosure: I'm the MD of SciChart!
© 2022 - 2024 — McMap. All rights reserved.

