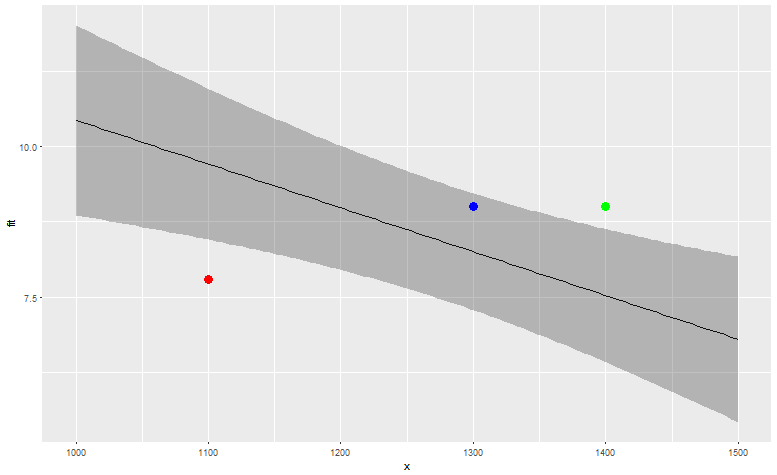
I have a data set which has driver trip information as mentioned below. My objective is to come up with a new mileage or an adjusted mileage which takes into account the load a driver is carrying and the vehicle he/she is driving. Because we found that there is a negative correlation between mileage and load. So the more load you are carrying the less mileage you might get. Also, the type of vehicle might impact your performance as well. In a way we are trying to normalize the mileage so that a driver who is given a heavy load and gets less mileage because of that might not be punished on a mileage. So far I have used Linear regression and correlation to see the relationship between Mileage and the load a driver is carrying. The correlation was -.6. Dependent variable is Miles per Gal and Independent variables are load and Vehicle.
Drv Miles per Gal   Load(lbs)   Vehicle
A        7           1500   2016 Tundra
B        8           1300   2016 Tundra
C        8           1400   2016 Tundra
D        9           1200   2016 Tundra
E       10           1000   2016 Tundra
F        6           1500   2017 F150
G        6           1300   2017 F150
H        7           1400   2017 F150
I        9           1300   2017 F150
J       10           1100   2017 F150
The results might be like this.
Drv Result-New Mileage
A   7.8
B   8.1
C   8.3
D   8.9
E   9.1
F   8.3
G   7.8
H   8
I   8.5
J   9
So far i am little skeptical as to how should I use the slopes from LR to normalize these scores. Any other feedback on approach would be helpful.
Our ultimate goal is to rank the drivers based on Miles per gallon by taking into account the affects of load and vehicle.
Thanks Jay

