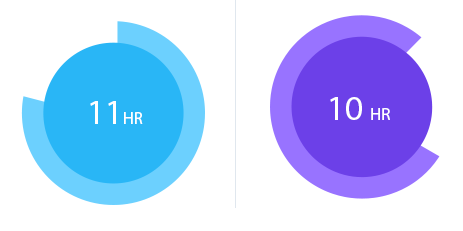
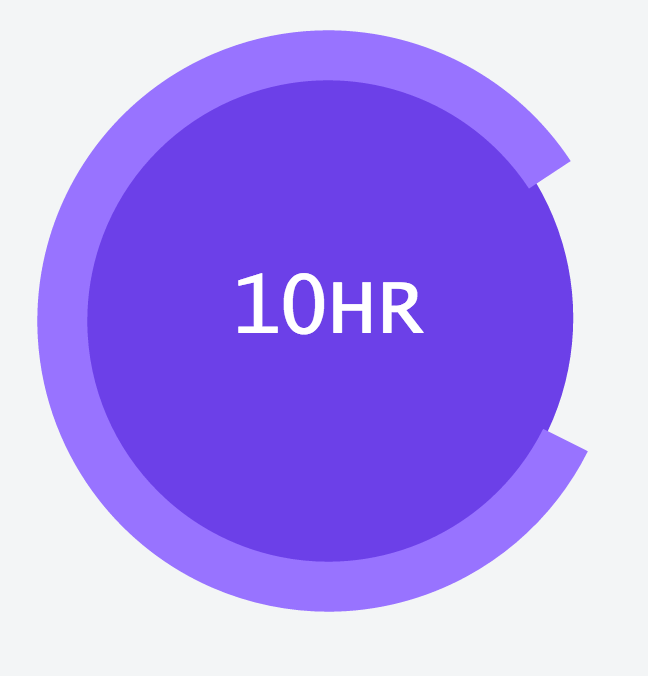
 Trying to create the above using c3.js.
We are using the same charting library across the application so would like to keep it consistent. Didn't find a way in c3.js to either customize donut or pie chart to get this. i need it to be hour, instead of percentage . and also the target value should be 12 instead of 100%. Any help or pointers are greatly appreciated.
normal jsfiddle link to customise.
var chart = c3.generate({
 bindto: '#pie-chart',
data: {
    columns: [
        ['data1', 30],
        ['data2', 120],
    ],
    type : 'donut',
    onclick: function (d, i) { console.log("onclick", d, i); },
    onmouseover: function (d, i) { console.log("onmouseover", d, i); },
    onmouseout: function (d, i) { console.log("onmouseout", d, i); }
},
donut: {
    title: "Iris Petal Width"
}
});

setTimeout(function () {
chart.load({
    columns: [
        ["setosa", 0.2, 0.2, 0.2, 0.2, 0.2, 0.4, 0.3, 0.2, 0.2, 0.1, 0.2, 0.2, 0.1, 0.1, 0.2, 0.4, 0.4, 0.3, 0.3, 0.3, 0.2, 0.4, 0.2, 0.5, 0.2, 0.2, 0.4, 0.2, 0.2, 0.2, 0.2, 0.4, 0.1, 0.2, 0.2, 0.2, 0.2, 0.1, 0.2, 0.2, 0.3, 0.3, 0.2, 0.6, 0.4, 0.3, 0.2, 0.2, 0.2, 0.2],
        ["versicolor", 1.4, 1.5, 1.5, 1.3, 1.5, 1.3, 1.6, 1.0, 1.3, 1.4, 1.0, 1.5, 1.0, 1.4, 1.3, 1.4, 1.5, 1.0, 1.5, 1.1, 1.8, 1.3, 1.5, 1.2, 1.3, 1.4, 1.4, 1.7, 1.5, 1.0, 1.1, 1.0, 1.2, 1.6, 1.5, 1.6, 1.5, 1.3, 1.3, 1.3, 1.2, 1.4, 1.2, 1.0, 1.3, 1.2, 1.3, 1.3, 1.1, 1.3],

    ]
});
}, 1500);

setTimeout(function () {
chart.unload({
    ids: 'data1'
});
chart.unload({
    ids: 'data2'
});
}, 2500);


donut.label.format = function (value, ratio) { return value; }, but i didn't get how to pass the value and ratio into it. can you please guide me, how to use it. thank you – Karelian