According to the documentation, alpha must be a positive float. Your example has alpha=0 as an integer. Using a small positive alpha, the results of Ridge and LinearRegression appear to converge.
from sklearn.linear_model import Ridge, LinearRegression
data = [[0, 0], [1, 1], [2, 2]]
target = [0, 1, 2]

ridge_model = Ridge(alpha=1e-8).fit(data, target)
print("RIDGE COEFS: " + str(ridge_model.coef_))
ols = LinearRegression().fit(data,target)
print("OLS COEFS: " + str(ols.coef_))

# RIDGE COEFS: [ 0.49999999  0.50000001]
# OLS COEFS: [ 0.5  0.5]
#
# VS. with alpha=0:
# RIDGE COEFS: [  1.57009246e-16   1.00000000e+00]
# OLS COEFS: [ 0.5  0.5]
UPDATE
The issue with an alpha=0 as int above seems to only be an issue with a few toy problems like the example above.
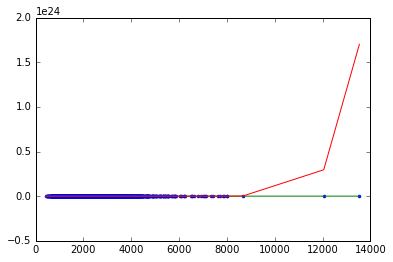
For the housing data, the issue is one of scaling. The 15-degree polynomial you invoke is causing numerical overflow. To produce identical results from LinearRegression and Ridge, try scaling your data first:
import pandas as pd
from sklearn.linear_model import Ridge, LinearRegression
from sklearn.preprocessing import PolynomialFeatures, scale

dataset = pd.read_csv('house_price_data.csv')

# scale the X data to prevent numerical errors.
X = scale(dataset['sqft_living'].reshape(-1, 1))
Y = dataset['price'].reshape(-1, 1)

polyX = PolynomialFeatures(degree=15).fit_transform(X)

model1 = LinearRegression().fit(polyX, Y)
model2 = Ridge(alpha=0).fit(polyX, Y)

print("OLS Coefs: " + str(model1.coef_[0]))
print("Ridge Coefs: " + str(model2.coef_[0]))

#OLS Coefs: [  0.00000000e+00   2.69625315e+04   3.20058010e+04  -8.23455994e+04
#  -7.67529485e+04   1.27831360e+05   9.61619464e+04  -8.47728622e+04
#  -5.67810971e+04   2.94638384e+04   1.60272961e+04  -5.71555266e+03
#  -2.10880344e+03   5.92090729e+02   1.03986456e+02  -2.55313741e+01]
#Ridge Coefs: [  0.00000000e+00   2.69625315e+04   3.20058010e+04  -8.23455994e+04
#  -7.67529485e+04   1.27831360e+05   9.61619464e+04  -8.47728622e+04
#  -5.67810971e+04   2.94638384e+04   1.60272961e+04  -5.71555266e+03
#  -2.10880344e+03   5.92090729e+02   1.03986456e+02  -2.55313741e+01]

