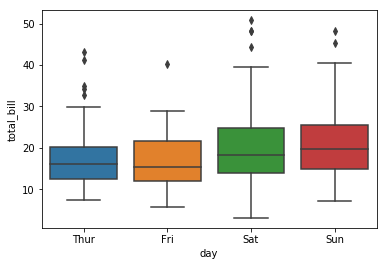
To my knowledge, this is not possible with seaborn because it sadly does not provide any means of modifying the positions keyword. See also this similar question.
The easiest workaround is to use a different boxplot function, for example the one that comes with pandas dataframes:
bplot = tips.boxplot(by="day", column="total_bill", positions=[1,2,3,4.5])
Of course, this is nowhere near as nicely styled as the seaborn version.
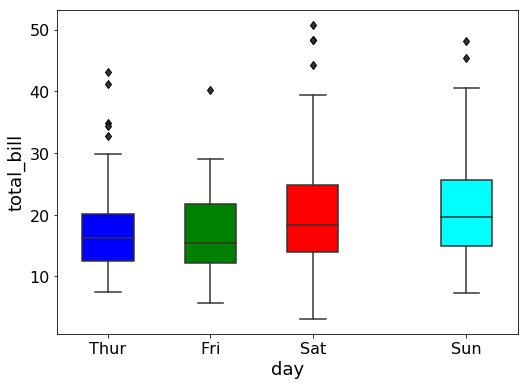
Fortunately, matplotlib provides infinite options to those willing to explore them, so one could create something similar to the seaborn plot by modifying the different parts of the plot accordingly.
This comes close:
# Prep
import matplotlib.pyplot as plt
import seaborn as sns
tips = sns.load_dataset("tips")

# Create boxplot
bplot = tips.boxplot(by="day", column="total_bill", positions=[1,2,3,4.5],
                     return_type='dict', figsize=(8,6), grid=False, patch_artist=True,
                     sym='d', fontsize=16)

# Style boxplot
colors = ['blue', 'green', 'red', 'cyan']
for patch, color in zip(bplot['total_bill']['boxes'], colors):
    patch.set_facecolor(color)
    patch.set_edgecolor('0.2')
    patch.set_linewidth(1.5)
for whisker in bplot['total_bill']['whiskers']:
    whisker.set_color('0.2')
    whisker.set_linewidth(1.5)
for fliers in bplot['total_bill']['fliers']:
    fliers.set_markerfacecolor('0.2')
for median in bplot['total_bill']['medians']:
    median.set_color('0.2')
    median.set_linewidth(1.5)
for caps in bplot['total_bill']['caps']:
    caps.set_color('0.2')
    caps.set_linewidth(1.5)

# Other adjustments
plt.title("")
plt.suptitle("")
plt.xlabel("day", fontsize=18)
plt.ylabel("total_bill", fontsize=18)
![enter image description here]()


