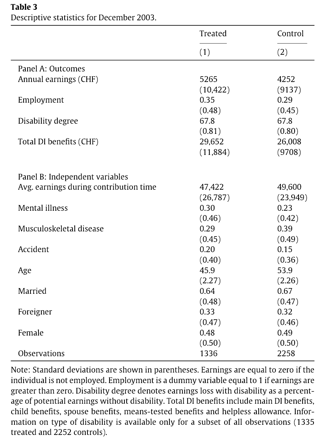
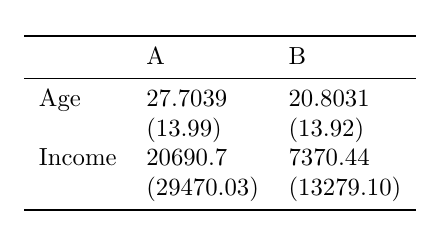
This question concerns the best-practice to do descriptive statistics in Python with a formatted output that correspond to tables found in academic publications: means with their respective standard deviations in parenthesis below. Final goal is to be able to export it in a Latex tabular format (or an other format, html, etc).
Example (Deucherta & Eugster (2018)):
Pandas:
The classical solution to do descriptive statistics in Pandas is to use the describe() method of a DataFrame.
import numpy as np
import pandas as pd

# Generate a DataFrame to have an example
df = pd.DataFrame(
    {"Age" : np.random.normal(20,15,5),
     "Income": np.random.pareto(1,5)*20_000 }
    )
# The describe method to get means and stds
df.describe().loc[["mean", "std"]].T
>>>
                mean            std
Age        15.322797      13.449727
Income  97755.733510  143683.686484
What I would like to have is the following output:
Age        15.32
          (13.44)
Income  97755.73
        (143683.68)
It would be nice to have a solution that works with Multi-index Dataframe:
df2 = pd.DataFrame(
    {"Age" : np.random.normal(20,15,5),
     "Income": np.random.pareto(1,5)*20_000 }
    )
df_c = pd.concat([df,df2], keys = ["A", "B"])
>>>
and get
                A           B
Age          23.15       21.33
            (11.62)      (9.34)
Income    68415.53    46619.51
         (95612.40)  (64596.10)
My current solution:
idx = pd.IndexSlice
df_desc = (df_c
      ).groupby(level = 0, axis = 0).describe()
df_desc = df_desc.loc[idx[:],idx[:,["mean", "std"]]].T
df_desc.loc[idx[:,["std"]],idx[:]] = df_desc.loc[idx[:,["std"]],idx[:]
                                               ].applymap(
                                               lambda x: "("+"{:.2f}".format(x)+")")
print(df_desc)

>>>
                     A           B
Age    mean     23.1565     21.3359
      std      (11.62)      (9.34)
Income mean     68415.5     46619.5
      std   (95612.40)  (64596.10)
I did not find the solution to hide the second index column [mean, std, mean,std].
Then I want to export my df to latex:
df_desc.to_latex()

>>>
\begin{tabular}{llll}
\toprule
       &     &            A &           B \\
\midrule
Age & mean &       5.5905 &     29.5894 \\
       & std &      (16.41) &     (13.03) \\
Income & mean &       531970 &     72653.7 \\
       & std &  (875272.44) &  (79690.18) \\
\bottomrule
\end{tabular}
The & characters of the table are not aligned which makes it a bit tedious to edit (I use extensions for aligning & in VSCode)
Overall I find this solution tedious and not elegant.
Solution(s) ?
I do not know what I should do to obtain the desired result without complex string manipulation.
I have looked at Pandas styling, but I don't think that it is the best solution.
There is also StatModels Tables, but I did not find a simple solution to my problem. Statsmodels Tables seems the most promising solution. But I do not know how to implement it. There are some descriptive stats functions in StatsModels, but I read on GitHub that they are to some extent deprecated.
So what is the best way to make those tables?


