How does Branch Prediction affect performance in R?
Asked Answered
A

1

9

Some references:

This is a follow-up on this Why is processing a sorted array faster than processing an unsorted array?

The only post in tag that I found somewhat related to branch prediction was this Why sampling matrix row is very slow?

Explanation of the problem:

I was investigating whether processing a sorted array is faster than processing an unsorted one (same as the problem tested in Java and C – first link) to see if branch prediction is affecting R in the same manner.

See the benchmark examples below:

set.seed(128)
#or making a vector with 1e7
myvec <- rnorm(1e8, 128, 128)  

myvecsorted <- sort(myvec)

mysumU = 0
mysumS = 0

SvU <- microbenchmark::microbenchmark(
  Unsorted = for (i in 1:length(myvec)) {
    
    if (myvec[i] > 128) {
      mysumU = mysumU + myvec[i]
    }
    
  } ,
  Sorted = for (i in 1:length(myvecsorted)) {
    
    if (myvecsorted[i] > 128) {
      mysumS = mysumS + myvecsorted[i]
    }
    
  } ,
  times = 10)

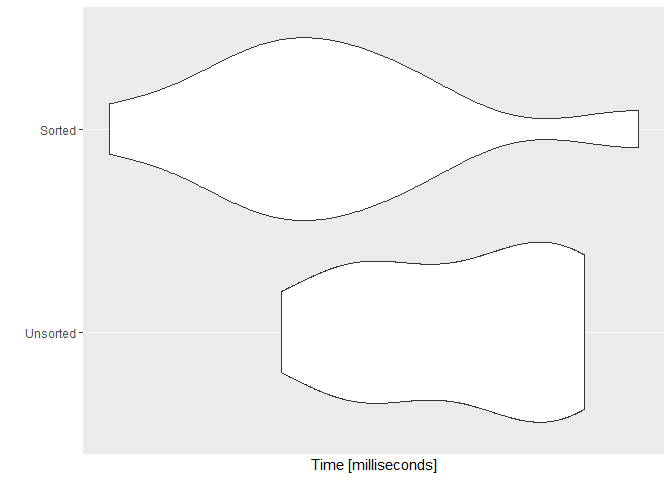
ggplot2::autoplot(SvU)

Question:

  • First, I want to know that why "Sorted" vector is not the fastest all the time and not by the same magnitude as expressed in Java?
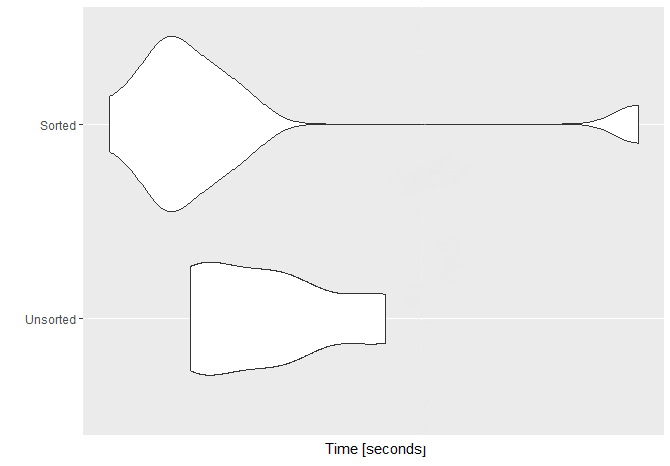
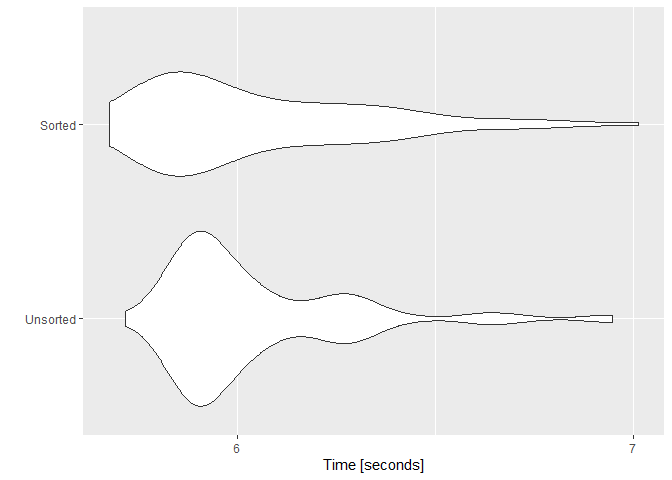
  • Second, why the sorted execution time has a higher variation compared to one of the unsorted?

N.B. My CPU is an i7-6820HQ @ 2.70GHz Skylake, quad-core with hyperthreading.

Update:

To investigate the variation part, I did the microbenchmark with the vector of 100 million elements (n=1e8) and repeated the benchmark 100 times (times=100). Here's the associated plot with that benchmark.

Here's my sessioninfo:

R version 3.6.1 (2019-07-05)
Platform: x86_64-w64-mingw32/x64 (64-bit)
Running under: Windows 10 x64 (build 16299)

Matrix products: default

locale:
[1] LC_COLLATE=English_United States.1252  LC_CTYPE=English_United States.1252    LC_MONETARY=English_United States.1252
[4] LC_NUMERIC=C                           LC_TIME=English_United States.1252    

attached base packages:
[1] compiler  stats     graphics  grDevices utils     datasets  methods   base     

other attached packages:
[1] rstudioapi_0.10      reprex_0.3.0         cli_1.1.0            pkgconfig_2.0.3      evaluate_0.14        rlang_0.4.0         
[7] Rcpp_1.0.2           microbenchmark_1.4-7 ggplot2_3.2.1 
Africanize answered 15/10, 2019 at 16:53 Comment(4)
Some helpful links about R Language: 1.Evaluating the Design of the R Language 2. Implementing Persistent O(1) Stacks and Queues in R 3. A Byte Code Compiler for RAfricanize
the first link in @M--'s link seem to be broken, but might be here.Rochelrochell
Not exactly the same, but related problem: Why does R's duplicated perform better on sorted dataCuspidate
You should recheck the benchmarks after running compiler::enableJIT(0).Lepidosiren
T
6

Interpreter overhead, and just being an interpreter, explains most of the average difference. I don't have an explanation for the higher variance.


R is an interpreted language, not JIT compiled to machine code like Java, or ahead-of-time like C. (I don't know much about R internals, just CPUs and performance, so I'm making a lot of assumptions here.)

The code that's running on the actual CPU hardware is the R interpreter, not exactly your R program.

Control dependencies in the R program (like an if()) become data dependencies in the interpreter. The current thing being executed is just data for the interpreter running on a real CPU.

Different operations in the R program become control dependencies in the interpreter. For example, evaluating myvec[i] then the + operator would probably be done by two different functions in the interpreter. And a separate function for > and for if() statements.

The classic interpreter loop is based around an indirect branch that dispatches from a table of function pointers. Instead of a taken/not-taken choice, the CPU needs a prediction for one of many recently-used target addresses. I don't know if R uses a single indirect branch like that or if tries to be fancier like having the end of each interpreter block dispatch to the next one, instead of returning to a main dispatch loop.

Modern Intel CPUs (like Haswell and later) have IT-TAGE (Indirect TAgged GEometric history length) prediction. The taken/not-taken state of previous branches along the path of execution are used as an index into a table of predictions. This mostly solves the interpreter branch-prediction problem, allowing it to do a surprisingly good job, especially when the interpreted code (the R code in your case) does the same thing repeatedly.

The if() being taken does result in needing to do different operations, so it does actually still make some branching in the R interpreter more or less predictable depending on data. But of course as an interpreter, it's doing much more work at each step than a simple machine-code loop over an array.

So extra branch mispredicts are a much smaller fraction of the total time because of interpreter overhead.


Of course, both your tests are with the same interpreter on the same hardware. I don't know what kind of CPU you have.

If it's Intel older than Haswell or AMD older than Zen, you might be getting a lot of mispredicts even with the sorted array, unless the pattern is simple enough for an indirect branch history predictor to lock onto. That would bury the difference in more noise.

Since you do see a pretty clear difference, I'm guessing that the CPU doesn't mispredict too much in the sorted case, so there is room for it to get worse in the unsorted case.

Thighbone answered 15/10, 2019 at 17:46 Comment(2)
Thanks Peter. I need to spend some time to read your answer in details as it is a well-written, comprehensive one. But just to address your wonder about my CPU, here's the info: Intel(R) Core(TM) i7-6820HQ CPU @ 2.70GHz, 2701 Mhz, 4 Core(s), 8 Logical Processor(s)p.s. If you are updating your answer based on this, please leave the existing since it addresses the problem in general and not specifically for my config.Africanize
@M--: Ok, that's a Skylake, the generation after Haswell. So yes, you have ITTAGE branch prediction like I was guessing.Thighbone

© 2022 - 2024 — McMap. All rights reserved.