I have a question about g1gc.
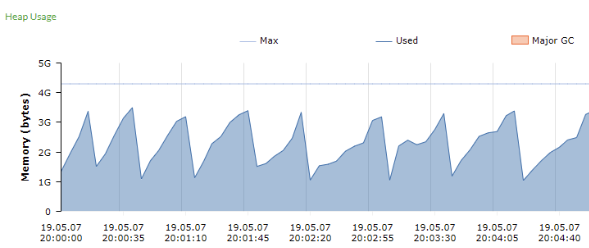
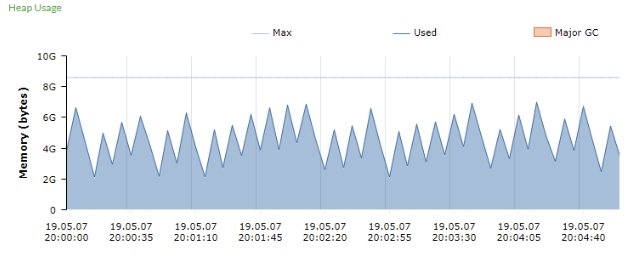
These are the heap usage graph.
The above is -Xms4g -Xmx4g.
The bottom is -Xms8g -Xmx8g.
I don't know why the 8g option causes g1gc to happen more often. Other options are all default.
And server spec is 40 logical process.
ps. What are the proper tuning options?
addtional question
Can the memory allocation be faster because the larger the memory size -> the larger the region size?
gc.log
4G gc.log
2019-05-07T21:03:42.093+0900: 10.280: [GC pause (G1 Evacuation Pause) (young), 0.1785373 secs]
   [Parallel Time: 43.4 ms, GC Workers: 28]
      [GC Worker Start (ms): Min: 10280.0, Avg: 10280.1, Max: 10280.6, Diff: 0.6]
      [Ext Root Scanning (ms): Min: 0.0, Avg: 0.4, Max: 0.8, Diff: 0.8, Sum: 12.0]
      [Update RS (ms): Min: 0.8, Avg: 1.1, Max: 1.6, Diff: 0.8, Sum: 31.5]
         [Processed Buffers: Min: 0, Avg: 2.0, Max: 3, Diff: 3, Sum: 56]
      [Scan RS (ms): Min: 0.0, Avg: 0.4, Max: 0.7, Diff: 0.7, Sum: 10.9]
      [Code Root Scanning (ms): Min: 0.0, Avg: 0.0, Max: 0.0, Diff: 0.0, Sum: 0.0]
      [Object Copy (ms): Min: 38.0, Avg: 38.5, Max: 39.9, Diff: 1.9, Sum: 1079.0]
      [Termination (ms): Min: 1.3, Avg: 2.6, Max: 3.2, Diff: 1.9, Sum: 74.1]
         [Termination Attempts: Min: 413, Avg: 769.6, Max: 855, Diff: 442, Sum: 21549]
      [GC Worker Other (ms): Min: 0.0, Avg: 0.1, Max: 0.2, Diff: 0.1, Sum: 2.0]
      [GC Worker Total (ms): Min: 42.7, Avg: 43.2, Max: 43.4, Diff: 0.7, Sum: 1209.5]
      [GC Worker End (ms): Min: 10323.3, Avg: 10323.3, Max: 10323.4, Diff: 0.1]
   [Code Root Fixup: 0.0 ms]
   [Code Root Purge: 0.0 ms]
   [Clear CT: 0.4 ms]
   [Other: 134.7 ms]
      [Choose CSet: 0.0 ms]
      [Ref Proc: 132.4 ms]
      [Ref Enq: 0.9 ms]
      [Redirty Cards: 0.3 ms]
      [Humongous Register: 0.1 ms]
      [Humongous Reclaim: 0.0 ms]
      [Free CSet: 0.7 ms]
   [Eden: 928.0M(928.0M)->0.0B(828.0M) Survivors: 26.0M->120.0M Heap: 1193.0M(4096.0M)->409.0M(4096.0M)]
Heap after GC invocations=8 (full 0):
 garbage-first heap   total 4194304K, used 418816K [0x00000006c0000000, 0x00000006c0204000, 0x00000007c0000000)
  region size 2048K, 60 young (122880K), 60 survivors (122880K)
 Metaspace       used 28525K, capacity 30824K, committed 31104K, reserved 1077248K
  class space    used 3583K, capacity 4166K, committed 4224K, reserved 1048576K
}
 [Times: user=1.21 sys=0.08, real=0.18 secs]
{Heap before GC invocations=8 (full 0):
 garbage-first heap   total 4194304K, used 744448K [0x00000006c0000000, 0x00000006c0204000, 0x00000007c0000000)
  region size 2048K, 219 young (448512K), 60 survivors (122880K)
 Metaspace       used 28525K, capacity 30824K, committed 31104K, reserved 1077248K
  class space    used 3583K, capacity 4166K, committed 4224K, reserved 1048576K
2019-05-07T21:03:42.895+0900: 11.082: [GC pause (G1 Evacuation Pause) (young), 0.0505563 secs]
   [Parallel Time: 11.6 ms, GC Workers: 28]
      [GC Worker Start (ms): Min: 11082.3, Avg: 11082.6, Max: 11083.6, Diff: 1.3]
      [Ext Root Scanning (ms): Min: 0.0, Avg: 0.4, Max: 0.8, Diff: 0.8, Sum: 9.9]
      [Update RS (ms): Min: 0.4, Avg: 1.0, Max: 1.5, Diff: 1.1, Sum: 29.4]
         [Processed Buffers: Min: 1, Avg: 1.8, Max: 3, Diff: 2, Sum: 50]
      [Scan RS (ms): Min: 0.8, Avg: 1.2, Max: 1.4, Diff: 0.6, Sum: 32.4]
      [Code Root Scanning (ms): Min: 0.0, Avg: 0.0, Max: 0.0, Diff: 0.0, Sum: 0.0]
      [Object Copy (ms): Min: 8.3, Avg: 8.4, Max: 8.6, Diff: 0.2, Sum: 236.3]
      [Termination (ms): Min: 0.0, Avg: 0.1, Max: 0.1, Diff: 0.1, Sum: 2.8]
         [Termination Attempts: Min: 1, Avg: 42.7, Max: 52, Diff: 51, Sum: 1195]
      [GC Worker Other (ms): Min: 0.0, Avg: 0.1, Max: 0.2, Diff: 0.1, Sum: 2.0]
      [GC Worker Total (ms): Min: 10.2, Avg: 11.2, Max: 11.5, Diff: 1.3, Sum: 312.9]
      [GC Worker End (ms): Min: 11093.7, Avg: 11093.8, Max: 11093.8, Diff: 0.1]
   [Code Root Fixup: 0.0 ms]
   [Code Root Purge: 0.0 ms]
   [Clear CT: 0.3 ms]
   [Other: 38.6 ms]
      [Choose CSet: 0.0 ms]
      [Ref Proc: 37.0 ms]
      [Ref Enq: 0.5 ms]
      [Redirty Cards: 0.3 ms]
      [Humongous Register: 0.1 ms]
      [Humongous Reclaim: 0.0 ms]
      [Free CSet: 0.5 ms]
   [Eden: 318.0M(252.0M)->0.0B(1052.0M) Survivors: 120.0M->48.0M Heap: 727.0M(4096.0M)->397.0M(4096.0M)]
Heap after GC invocations=9 (full 0):
 garbage-first heap   total 4194304K, used 406528K [0x00000006c0000000, 0x00000006c0204000, 0x00000007c0000000)
  region size 2048K, 24 young (49152K), 24 survivors (49152K)
 Metaspace       used 28525K, capacity 30824K, committed 31104K, reserved 1077248K
  class space    used 3583K, capacity 4166K, committed 4224K, reserved 1048576K
}
 [Times: user=0.34 sys=0.02, real=0.05 secs]
{Heap before GC invocations=9 (full 0):
 garbage-first heap   total 4194304K, used 912384K [0x00000006c0000000, 0x00000006c0204000, 0x00000007c0000000)
  region size 2048K, 271 young (555008K), 24 survivors (49152K)
 Metaspace       used 29461K, capacity 31868K, committed 32256K, reserved 1077248K
  class space    used 3681K, capacity 4237K, committed 4352K, reserved 1048576K
8G gc.log
2019-05-05T02:39:16.996+0900: 201016.724: [GC pause (G1 Evacuation Pause) (young), 0.0336675 secs]
   [Parallel Time: 12.9 ms, GC Workers: 28]
      [GC Worker Start (ms): Min: 201016724.7, Avg: 201016724.9, Max: 201016725.0, Diff: 0.2]
      [Ext Root Scanning (ms): Min: 0.8, Avg: 1.2, Max: 5.2, Diff: 4.4, Sum: 32.4]
      [Update RS (ms): Min: 0.0, Avg: 3.1, Max: 3.5, Diff: 3.5, Sum: 87.7]
         [Processed Buffers: Min: 0, Avg: 11.1, Max: 30, Diff: 30, Sum: 310]
      [Scan RS (ms): Min: 0.1, Avg: 0.3, Max: 0.3, Diff: 0.2, Sum: 7.3]
      [Code Root Scanning (ms): Min: 0.0, Avg: 0.0, Max: 0.0, Diff: 0.0, Sum: 0.1]
      [Object Copy (ms): Min: 6.9, Avg: 7.5, Max: 7.7, Diff: 0.8, Sum: 211.2]
      [Termination (ms): Min: 0.2, Avg: 0.3, Max: 0.4, Diff: 0.2, Sum: 9.0]
         [Termination Attempts: Min: 105, Avg: 124.7, Max: 146, Diff: 41, Sum: 3491]
      [GC Worker Other (ms): Min: 0.0, Avg: 0.1, Max: 0.2, Diff: 0.2, Sum: 3.2]
      [GC Worker Total (ms): Min: 12.4, Avg: 12.5, Max: 12.7, Diff: 0.4, Sum: 350.8]
      [GC Worker End (ms): Min: 201016737.3, Avg: 201016737.4, Max: 201016737.5, Diff: 0.2]
   [Code Root Fixup: 0.0 ms]
   [Code Root Purge: 0.0 ms]
   [Clear CT: 0.7 ms]
   [Other: 20.0 ms]
      [Choose CSet: 0.0 ms]
      [Ref Proc: 17.2 ms]
      [Ref Enq: 0.2 ms]
      [Redirty Cards: 0.3 ms]
      [Humongous Register: 0.1 ms]
      [Humongous Reclaim: 0.0 ms]
      [Free CSet: 1.7 ms]
   [Eden: 4864.0M(4864.0M)->0.0B(4868.0M) Survivors: 48.0M->44.0M Heap: 5968.1M(8192.0M)->1091.2M(8192.0M)]
Heap after GC invocations=19405 (full 0):
 garbage-first heap   total 8388608K, used 1117388K [0x00000005c0000000, 0x00000005c0404000, 0x00000007c0000000)
  region size 4096K, 11 young (45056K), 11 survivors (45056K)
 Metaspace       used 187853K, capacity 205120K, committed 210176K, reserved 1232896K
  class space    used 22574K, capacity 25471K, committed 26368K, reserved 1048576K
}
 [Times: user=0.39 sys=0.00, real=0.04 secs]
{Heap before GC invocations=19405 (full 0):
 garbage-first heap   total 8388608K, used 6106497K [0x00000005c0000000, 0x00000005c0404000, 0x00000007c0000000)
  region size 4096K, 1228 young (5029888K), 11 survivors (45056K)
 Metaspace       used 187853K, capacity 205120K, committed 210176K, reserved 1232896K
  class space    used 22574K, capacity 25471K, committed 26368K, reserved 1048576K
2019-05-05T02:39:33.830+0900: 201033.558: [GC pause (G1 Evacuation Pause) (young), 0.0373282 secs]
2019-05-05T02:39:33.830+0900: 201033.558: [GC pause (G1 Evacuation Pause) (young), 0.0373282 secs]
   [Parallel Time: 13.9 ms, GC Workers: 28]
      [GC Worker Start (ms): Min: 201033558.4, Avg: 201033558.5, Max: 201033558.6, Diff: 0.2]
      [Ext Root Scanning (ms): Min: 0.8, Avg: 1.2, Max: 4.5, Diff: 3.7, Sum: 32.5]
      [Update RS (ms): Min: 0.0, Avg: 2.8, Max: 3.1, Diff: 3.1, Sum: 77.4]
         [Processed Buffers: Min: 0, Avg: 10.3, Max: 31, Diff: 31, Sum: 289]
      [Scan RS (ms): Min: 0.1, Avg: 0.3, Max: 0.3, Diff: 0.3, Sum: 7.1]
      [Code Root Scanning (ms): Min: 0.0, Avg: 0.0, Max: 0.0, Diff: 0.0, Sum: 0.1]
      [Object Copy (ms): Min: 8.5, Avg: 8.8, Max: 8.9, Diff: 0.4, Sum: 246.0]
      [Termination (ms): Min: 0.3, Avg: 0.4, Max: 0.5, Diff: 0.2, Sum: 12.0]
         [Termination Attempts: Min: 135, Avg: 156.5, Max: 175, Diff: 40, Sum: 4382]
      [GC Worker Other (ms): Min: 0.0, Avg: 0.1, Max: 0.2, Diff: 0.2, Sum: 3.3]
      [GC Worker Total (ms): Min: 13.3, Avg: 13.5, Max: 13.7, Diff: 0.3, Sum: 378.4]
      [GC Worker End (ms): Min: 201033571.9, Avg: 201033572.0, Max: 201033572.1, Diff: 0.2]
   [Code Root Fixup: 0.0 ms]
   [Code Root Purge: 0.0 ms]
   [Clear CT: 0.8 ms]
   [Other: 22.6 ms]
      [Choose CSet: 0.0 ms]
      [Ref Proc: 18.5 ms]
      [Ref Enq: 0.3 ms]
      [Redirty Cards: 1.0 ms]
      [Humongous Register: 0.1 ms]
      [Humongous Reclaim: 0.0 ms]
      [Free CSet: 2.1 ms]
   [Eden: 4868.0M(4868.0M)->0.0B(4880.0M) Survivors: 44.0M->32.0M Heap: 5963.4M(8192.0M)->1082.0M(8192.0M)]
Heap after GC invocations=19406 (full 0):
 garbage-first heap   total 8388608K, used 1107927K [0x00000005c0000000, 0x00000005c0404000, 0x00000007c0000000)
  region size 4096K, 8 young (32768K), 8 survivors (32768K)
 Metaspace       used 187853K, capacity 205120K, committed 210176K, reserved 1232896K
  class space    used 22574K, capacity 25471K, committed 26368K, reserved 1048576K
}
 [Times: user=0.41 sys=0.00, real=0.04 secs]
{Heap before GC invocations=19406 (full 0):
 garbage-first heap   total 8388608K, used 6122963K [0x00000005c0000000, 0x00000005c0404000, 0x00000007c0000000)
  region size 4096K, 1228 young (5029888K), 8 survivors (32768K)
 Metaspace       used 187853K, capacity 205120K, committed 210176K, reserved 1232896K
  class space    used 22574K, capacity 25471K, committed 26368K, reserved 1048576K


