I wrote an implementation of bubble sort to play around a bit with Groovy and see if --indy have any noticeable effect on the performance.
Essentially, it sorts a list of one thousand random integers one thousand times and measures the average execution time for sorting the list.
Half of the time the list is an Integer[], the other half it's an ArrayList<Integer>.
The results are really confusing me:
$ groovyc BubbleSort.groovy
$ time java -cp ~/.gvm/groovy/current/embeddable/groovy-all-2.4.3.jar:. BubbleSort
Average: 22.926ms
Min: 11.202ms
[...] 26.48s user 0.84s system 109% cpu 25.033 total

$ groovyc --indy BubbleSort.groovy
$ time java -cp ~/.gvm/groovy/current/embeddable/groovy-all-2.4.3-indy.jar:. BubbleSort
Average: 119.766ms
Min: 68.251ms
[...] 166.05s user 1.52s system 135% cpu 2:03.82 total
Looking at CPU usage when the benchmarks are running, CPU usage is a lot higher when compiled with --indy than without.

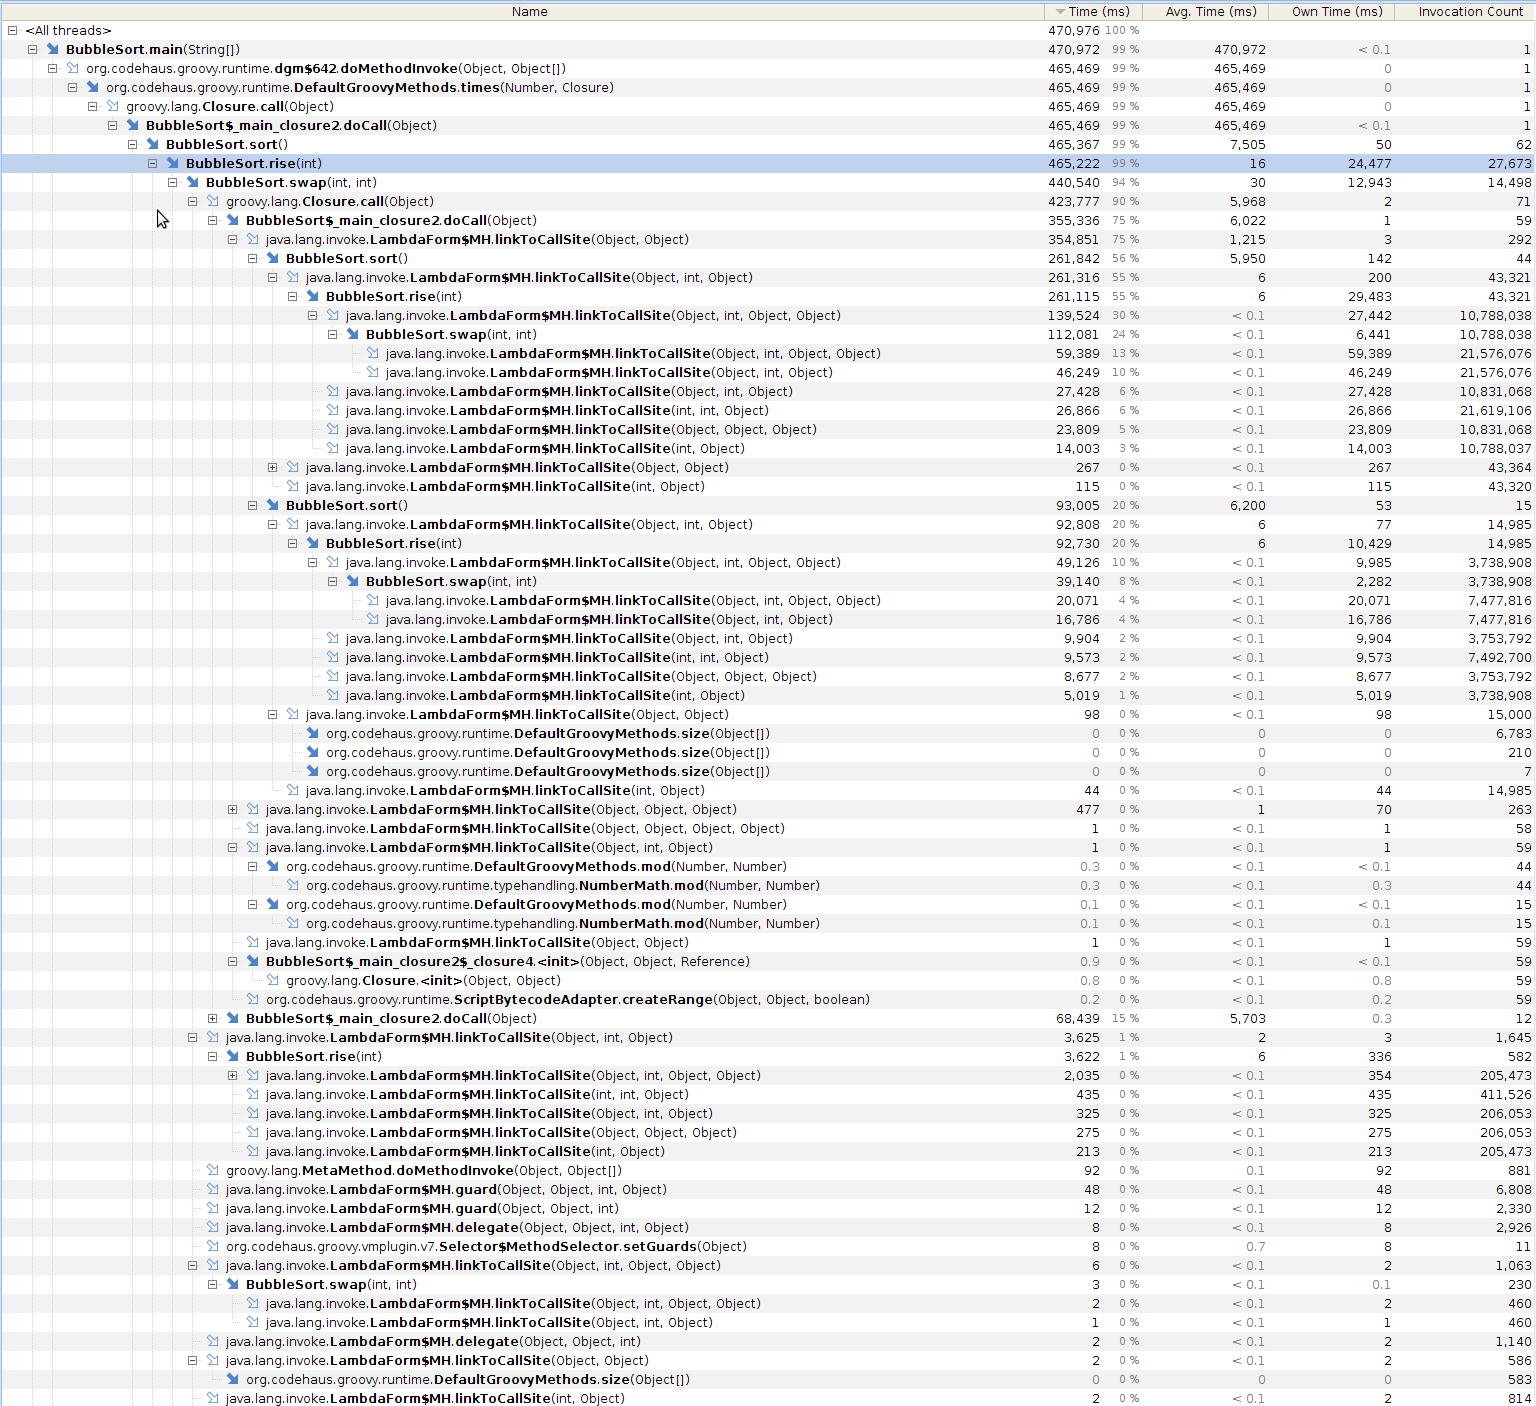
This intrigued me so I ran the benchmarks again - but this time with the Yourkit agent and CPU tracing enabled. Here are the recorded call trees:
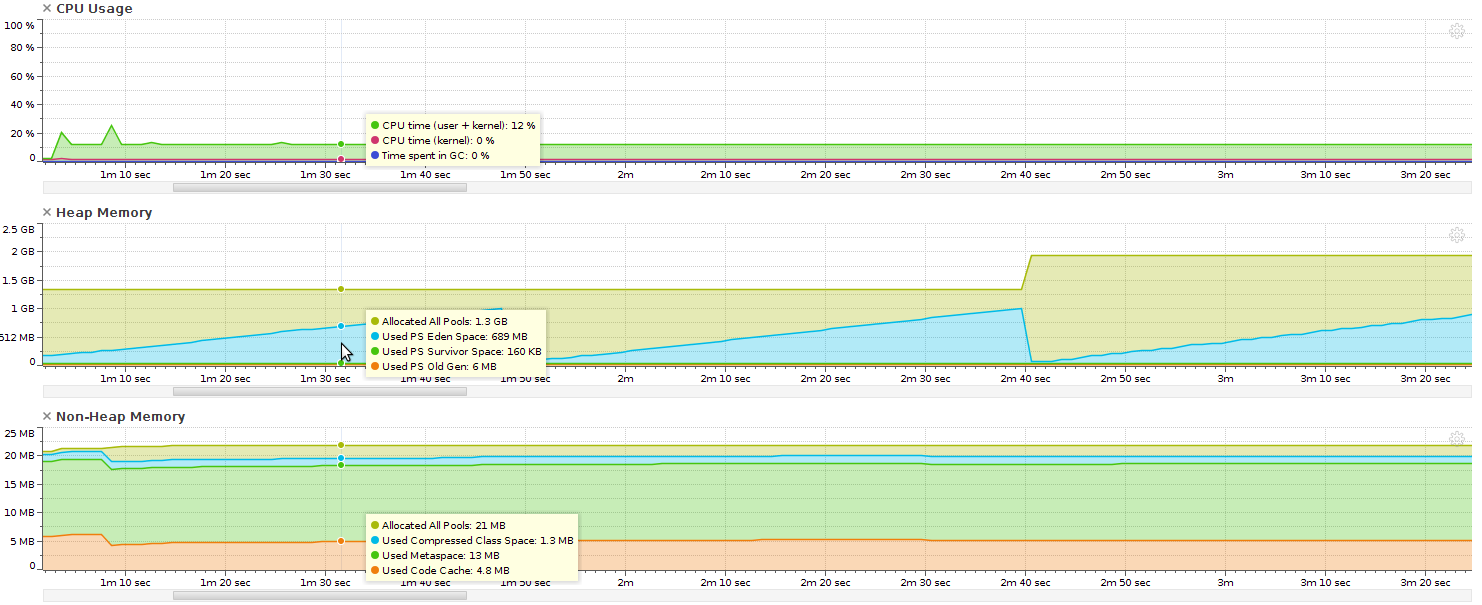
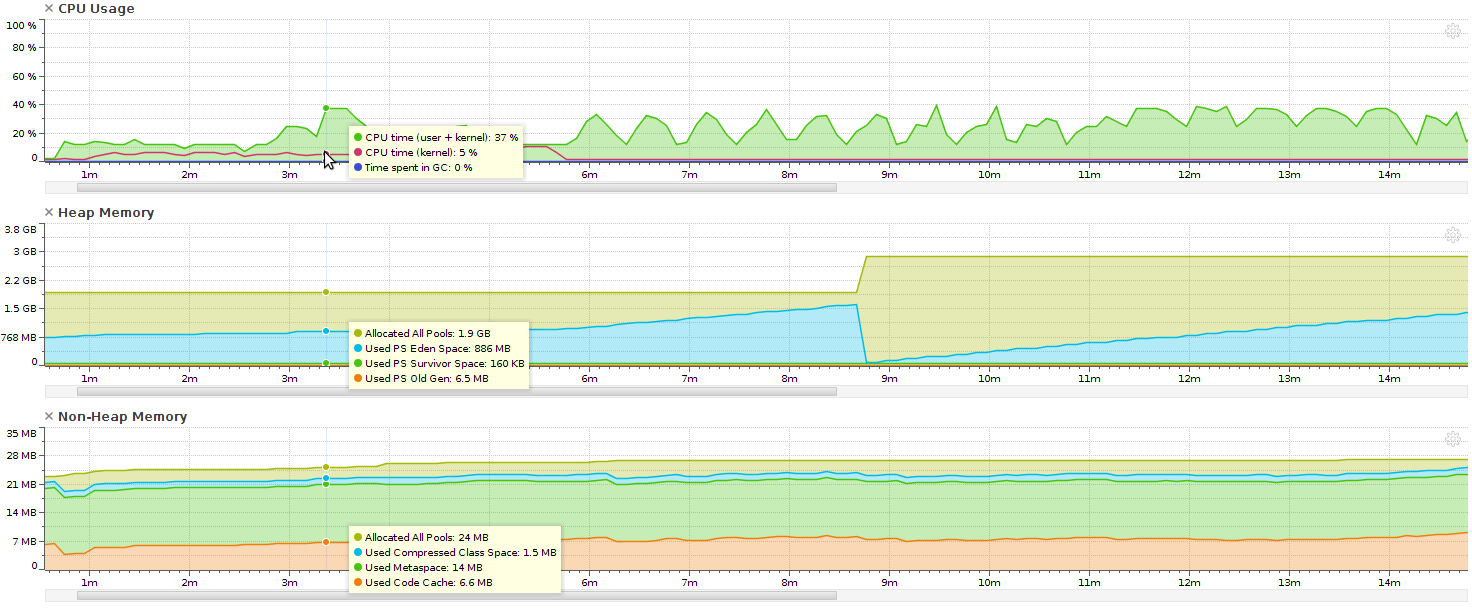
And here are the performance charts - note that the time scale is different because the --indy code is so much slower.
As can be seen, the CPU usage stabilises at 100% of one core (12.5% in the graph) when compiled without --indy but varies wildly between 12.5% and ~35% when compiled with --indy. What's even more confusing is that Yourkit only reports one live thread (and my code only uses the main thread), but it still manages to keep two and a half cores occupied.
The code compiled with --indy also uses a lot of kernel time at the start, though this drops and stabilises at 0% after a while - at which point the code seems to speed up a bit (heap usage growth-rate increases) and CPU usage increases.
Can anyone explain this behaviour to me?
Versions:
$ groovy -v
Groovy Version: 2.4.3 JVM: 1.8.0_45 Vendor: Oracle Corporation OS: Linux

$ java -version
java version "1.8.0_45"
Java(TM) SE Runtime Environment (build 1.8.0_45-b14)
Java HotSpot(TM) 64-Bit Server VM (build 25.45-b02, mixed mode)
BubbleSort.groovy:
class BubbleSort {
    final def array

    BubbleSort(final def array) {
        this.array = array
    }

    private void swap(int a, int b) {
        def tmp = array[a];
        array[a] = array[b]
        array[b] = tmp;
    }

    private void rise(int index) {
        for(int i = index; i > 0; i--) {
            if(array[i] < array[i - 1]) {
                swap(i, i-1)
            } else {
                break
            }
        }
    }

    void sort() {
        for(int i = 1; i < array.size(); i++) {
            rise i
        }
    }

    final static Random random = new Random()

    static void main(String[] args) {
        def n = 1000
        def size = 1000
        // Warm up
        doBenchmark 100, size
        def results = doBenchmark n, size
        printf("Average: %.3fms%n", results.total / 1e6 / n)
        printf("Min: %.3fms%n", results.min / 1e6)
    }

    private static def doBenchmark(int n, int size) {
        long total = 0
        long min = Long.MAX_VALUE
        n.times {
            def array = (1..size).collect { random.nextInt() }
            if(it % 2) {
                array = array as Integer[]
            }
            def start = System.nanoTime()
            new BubbleSort<Integer>(array).sort()
            def end = System.nanoTime()
            def time = end - start
            total += time
            min = Math.min min, time
        }
        return [total: total, min: min]
    }
}
I'm not interested in optimisations on my bubble sort implementation unless they are related to invokedynamic behaviour - the aim here isn't to write the best performing bubble sort possible but to come to grips with why --indy has such a large negative performance impact.
Update:
I converted my code to JRuby and tried the same thing and the results are similar, although JRuby isn't nearly as quick without invokedynamic:
$ JAVA_OPTS="-Djruby.compile.invokedynamic=false" jruby bubblesort.rb
Average: 78.714ms
Min: 35.000ms

$ JAVA_OPTS="-Djruby.compile.invokedynamic=true" jruby bubblesort.rb
Average: 136.287ms
Min: 92.000ms
Update 2:
If I remove the code that changes the list to an Integer[] half the time performance increases significantly, though it's still faster without --indy:
$ groovyc BubbleSort.groovy
$ java -cp ~/.gvm/groovy/current/embeddable/groovy-all-2.4.3.jar:. BubbleSort
Average: 29.794ms
Min: 26.577ms

$ groovyc --indy BubbleSort.groovy
$ java -cp ~/.gvm/groovy/current/embeddable/groovy-all-2.4.3-indy.jar:. BubbleSort
Average: 37.506ms
Min: 33.555ms
If I do the same with JRuby, invokedynamic is faster:
$ JAVA_OPTS="-Djruby.compile.invokedynamic=false" jruby bubblesort.rb
Average: 34.388ms
Min: 31.000ms

$ JAVA_OPTS="-Djruby.compile.invokedynamic=true" jruby bubblesort.rb
Average: 20.785ms
Min: 18.000ms


1.8.0_31and1.7.0_76; they both run equally fast (indy slightly faster with 1.8, slightly slower with 1.7) – Marceau10000elements and100000elements and l see how it develops… – Actino--indywith more items (I'll try to figure out a good number that will make it theoretically finish shortly before I arrive at work tomorrow morning) – Knowlton--indyon 1.7.0.80 is unchanged. With--indyit gets significantly slower after a few hundred iterations (we're talking order of magnitudes). – Knowlton