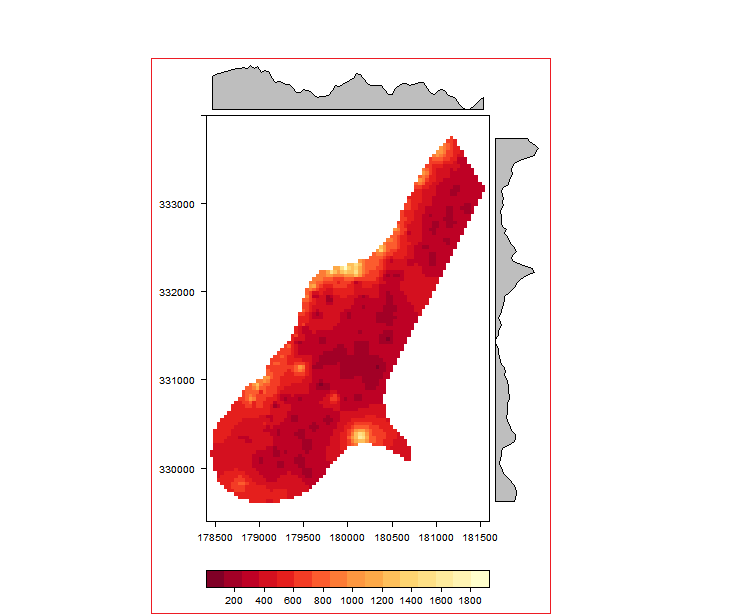
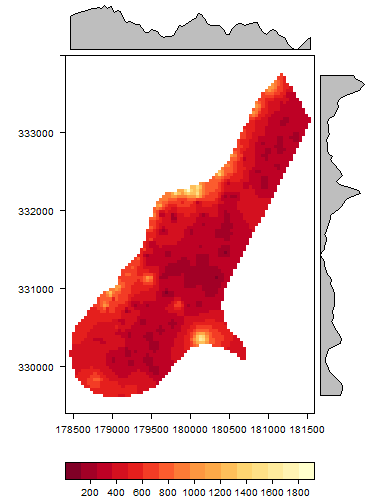
You can adjust the margins with the layout.heights and layout.widths arguments to lattice.options:
lattice.options(
  layout.heights=list(bottom.padding=list(x=0), top.padding=list(x=0)),
  layout.widths=list(left.padding=list(x=0), right.padding=list(x=0))
)
levelplot(r, margin=TRUE)
![enter image description here]()
Select the image above (e.g. by clicking to the right of it and dragging left) to verify that the margins are as expected.
However, white space will still fill the horizontal extent of the graphics device, so you need to either adjust the xlim so that the white space is within the plot rather than outside it, or just adjust the width of the device appropriately. I did the latter, which might take a bit of trial and error if plotting to a file, but which is straightforward if plotting to an x11/windows/quartz device (just resize the pane).


