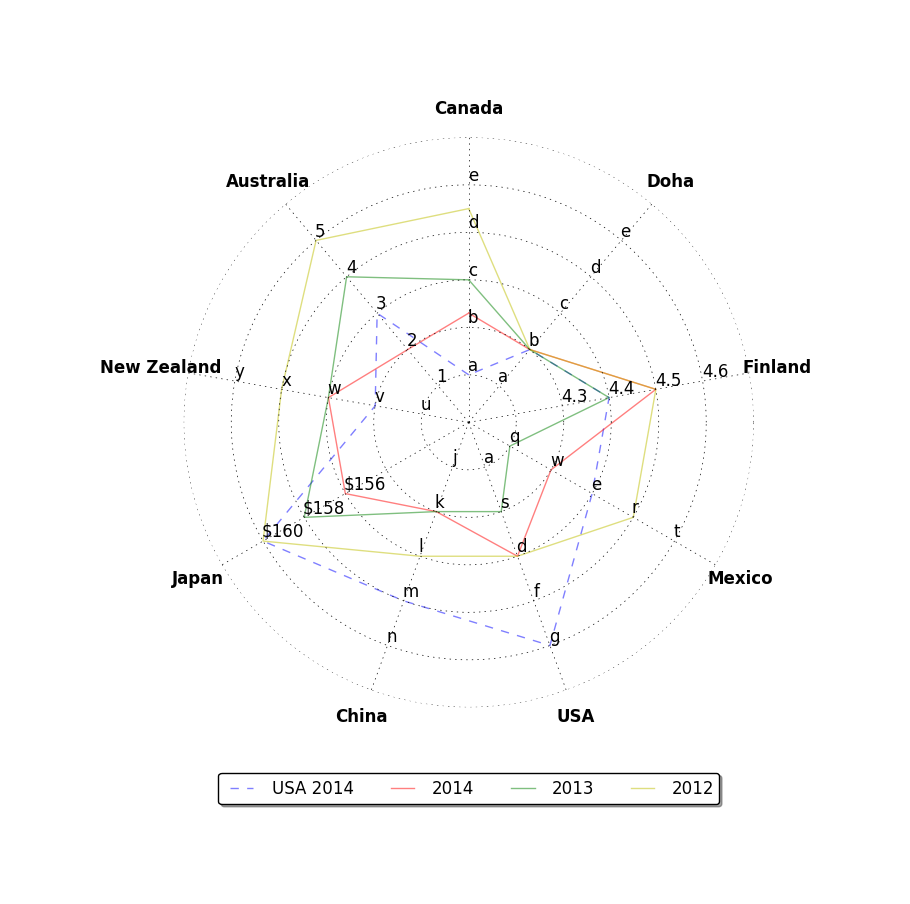
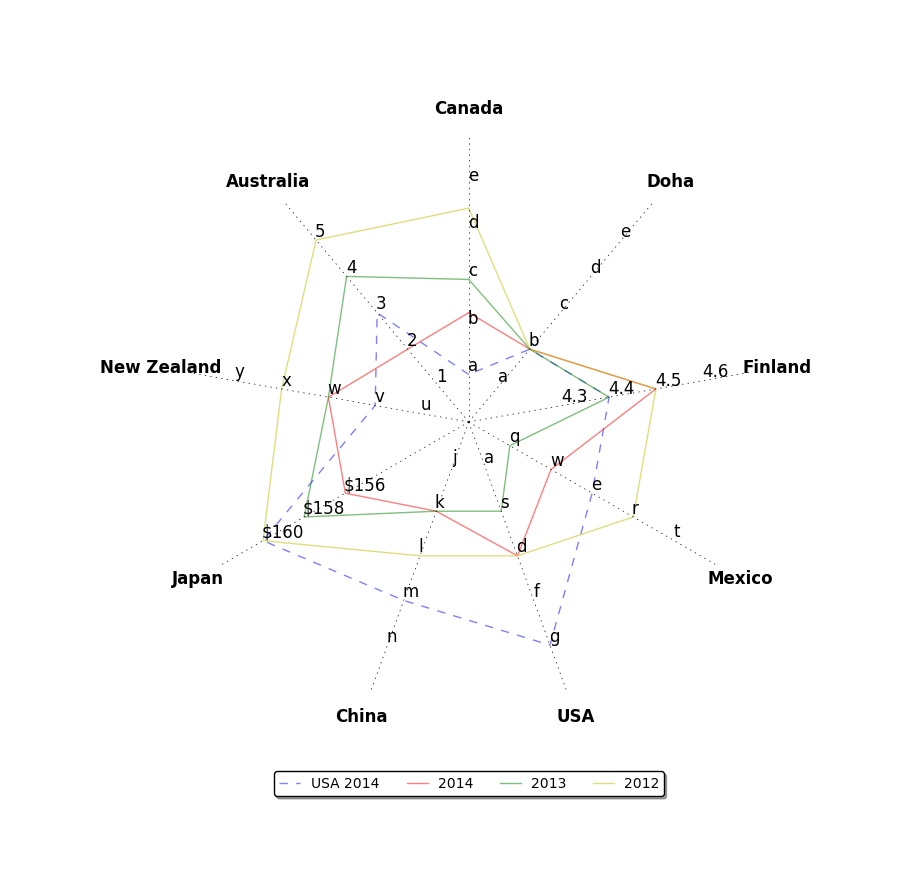
Could someone please help me remove the gridlines that form the rings inside my polar plot. I'd like to keep (and even bold) the axes and add ticks for each of the axis labels.
Here is the code that I'm working with, an image of the plot, and an image of what I want for the axes.
import numpy as np
import pylab as pl
import matplotlib.pyplot as py

class Radar(object):

    def __init__(self, fig, titles, labels, rect=None):
        if rect is None:
            rect = [0.05, 0.05, 0.95, 0.95]

            self.n = len(titles)
            self.angles = [a if a <=360. else a - 360. for a in np.arange(90, 90+360, 360.0/self.n)]
            self.axes = [fig.add_axes(rect, projection="polar", label="axes%d" % i)
                             for i in range(self.n)]

            self.ax = self.axes[0]
            self.ax.set_thetagrids(self.angles, labels=titles, fontsize=12, weight="bold")

            for ax in self.axes[1:]:
                ax.patch.set_visible(False)
                ax.grid("off")
                ax.xaxis.set_visible(False)

            for ax, angle, label in zip(self.axes, self.angles, labels):
                ax.set_rgrids(range(1, 7), labels=label, angle=angle, fontsize=12)
                ax.spines["polar"].set_visible(False)
                ax.set_ylim(0, 6)

    def plot(self, values, *args, **kw):
        angle = np.deg2rad(np.r_[self.angles, self.angles[0]])
        values = np.r_[values, values[0]]
        self.ax.plot(angle, values, *args, **kw)

fig = pl.figure(figsize=(20, 20))

titles = [
"Canada", "Australia",
"New Zealand", "Japan", "China", "USA", "Mexico", "Finland", "Doha"
]

labels = [
list("abcde"), list("12345"), list("uvwxy"),
[" ", " ", "$156", "$158", "$160"],
list("jklmn"), list("asdfg"), list("qwert"), [" ", "4.3", "4.4", "4.5", "4.6"], list("abcde")
]

radar = Radar(fig, titles, labels)
radar.plot([1, 3, 2, 5, 4, 5, 3, 3, 2],  "--", lw=1, color="b", alpha=.5, label="USA 2014")
radar.plot([2.3, 2, 3, 3, 2, 3, 2, 4, 2],"-", lw=1, color="r", alpha=.5, label="2014")
radar.plot([3, 4, 3, 4, 2, 2, 1, 3, 2], "-", lw=1, color="g", alpha=.5, label="2013")
radar.plot([4.5, 5, 4, 5, 3, 3, 4, 4, 2], "-", lw=1, color="y", alpha=.5, label="2012")

radar.ax.legend(loc='upper center', bbox_to_anchor=(0.5, -0.10),
      fancybox=True, shadow=True, ncol=4)

fig = py.gcf()
fig.set_size_inches(6, 10, forward=True)
fig.savefig('test2png.png', dpi=100, bbox_inches="tight", pad_inches=1)
Desired look:
Current look:


