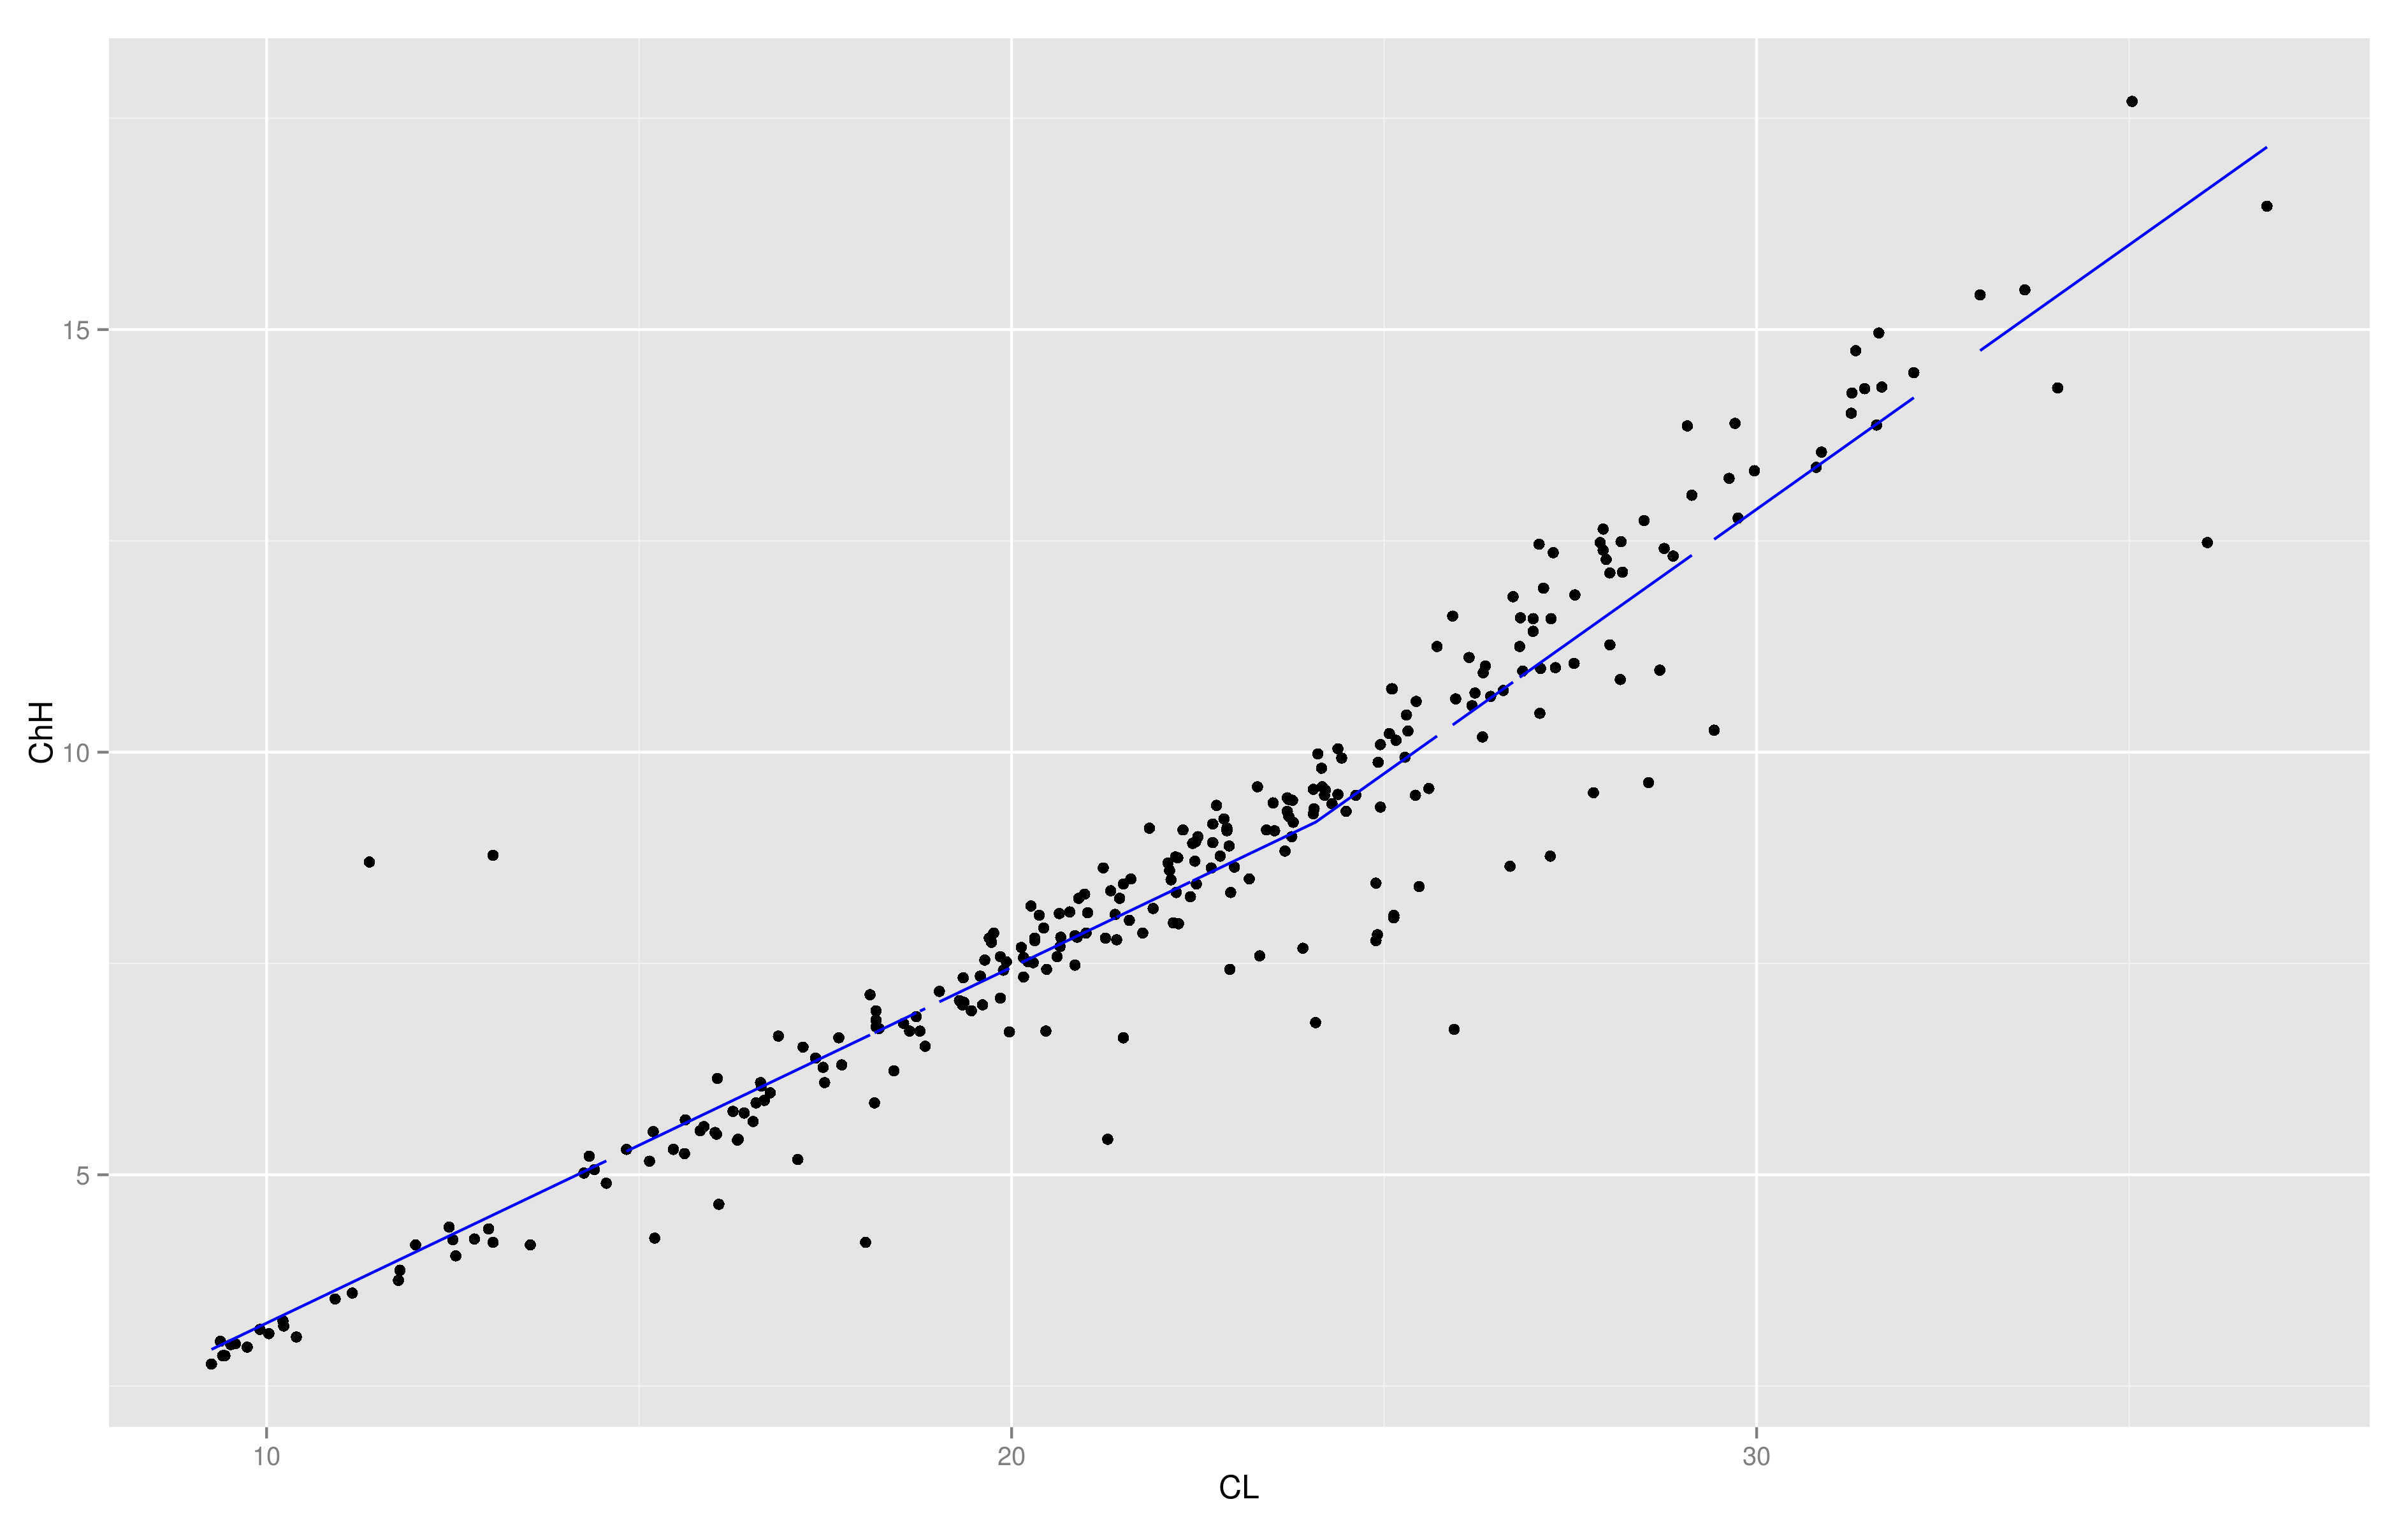
I followed these steps to plot the results of a piecewise linear regression with one breakpoint which I have done by segmented package:
lin.mod <- lm(ChH~CL)
segmented.mod <- segmented(lin.mod, seg.Z=~CL)
data1 <- data.frame(x = CL, y = ChH)
data2 <- data.frame(x = CL, y = broken.line(segmented.mod)$fit)
ggplot(data1, aes(x = CL, y = ChH)) +
  geom_point() +
  geom_line(data = data2, color = 'blue')
and I get this plot which does not show two lines with a breakpoint!!! How should I change my codes to get the correct plot?
This is my dataset: (ChH has 11 missing data)
CL <- c(9.26, 9.38, 9.41, 9.44, 9.52, 9.58, 9.74, 9.91, 10.03, 10.22,
10.23, 10.4, 10.92, 11.15, 11.38, 11.77, 11.79, 12, 12.45, 12.5,
12.54, 12.79, 12.98, 13.04, 13.04, 13.54, 14.26, 14.33, 14.4,
14.56, 14.77, 14.83, 15.14, 15.19, 15.21, 15.46, 15.61, 15.62,
15.82, 15.87, 16.02, 16.04, 16.05, 16.07, 16.26, 16.32, 16.33,
16.41, 16.53, 16.57, 16.63, 16.64, 16.68, 16.76, 16.87, 17.13,
17.2, 17.37, 17.47, 17.49, 17.68, 17.72, 18.04, 18.1, 18.14,
18.16, 18.18, 18.18, 18.18, 18.22, 18.42, 18.55, 18.63, 18.72,
18.75, 18.77, 18.84, 19, 19.03, 19.3, 19.34, 19.35, 19.36, 19.46,
19.58, 19.61, 19.64, 19.7, 19.73, 19.76, 19.85, 19.85, 19.89,
19.93, 19.97, 20.1, 20.13, 20.16, 20.16, 20.22, 20.26, 20.29,
20.31, 20.31, 20.37, 20.43, 20.46, 20.47, 20.61, 20.64, 20.65,
20.66, 20.78, 20.85, 20.85, 20.88, 20.9, 20.98, 21, 21.02, 21.23,
21.26, 21.29, 21.33, 21.39, 21.4, 21.41, 21.45, 21.5, 21.5, 21.58,
21.6, 21.76, 21.85, 21.9, 22.1, 22.12, 22.14, 22.17, 22.2, 22.21,
22.23, 22.24, 22.3, 22.4, 22.42, 22.43, 22.46, 22.47, 22.48,
22.5, 22.68, 22.7, 22.7, 22.75, 22.8, 22.85, 22.89, 22.89, 22.92,
22.93, 22.94, 22.99, 23.19, 23.3, 23.33, 23.42, 23.51, 23.53,
23.67, 23.7, 23.7, 23.72, 23.72, 23.76, 23.77, 23.78, 23.91,
24.05, 24.05, 24.06, 24.08, 24.11, 24.16, 24.17, 24.2, 24.21,
24.3, 24.38, 24.38, 24.43, 24.49, 24.62, 24.89, 24.89, 24.91,
24.92, 24.95, 24.95, 25.07, 25.1, 25.11, 25.13, 25.13, 25.16,
25.28, 25.3, 25.32, 25.42, 25.43, 25.47, 25.6, 25.71, 25.87,
25.92, 25.94, 25.96, 26.14, 26.18, 26.22, 26.32, 26.33, 26.36,
26.43, 26.6, 26.69, 26.73, 26.73, 26.82, 26.83, 26.86, 27, 27,
27.08, 27.09, 27.1, 27.14, 27.23, 27.24, 27.27, 27.3, 27.55,
27.56, 27.81, 27.9, 27.94, 27.94, 27.98, 28.03, 28.03, 28.17,
28.18, 28.2, 28.49, 28.55, 28.7, 28.76, 28.88, 29.07, 29.13,
29.23, 29.43, 29.63, 29.71, 29.75, 29.97, 30.8, 30.87, 31.27,
31.28, 31.33, 31.45, 31.61, 31.64, 31.68, 32.11, 32.91, 33, 33.6,
34.04, 35.04, 36.05, 36.85)
And:
ChH <- c(2.76, 3.03, 2.86, 2.86, 2.99, 3, 2.96, 3.17, 3.12, 3.27, 3.21,
3.08, 3.53, 3.6, 8.7, 3.75, 3.87, 4.17, 4.38, 4.23, 4.04, 4.24,
4.36, 4.2, 8.78, 4.17, 5.02, 5.22, 5.06, 4.9, NA, 5.3, 5.16,
5.51, 4.25, 5.3, 5.25, 5.65, 5.52, 5.57, 5.5, 5.48, 6.14, 4.65,
5.75, 5.41, 5.42, 5.73, 5.63, 5.85, 6.09, 6.05, 5.88, 5.97, 6.64,
5.18, 6.51, 6.38, 6.27, 6.09, 6.62, 6.3, 4.2, 7.13, NA, 5.85,
6.83, 6.75, 6.94, 6.73, 6.23, 6.79, 6.7, 6.87, NA, 6.7, 6.52,
NA, 7.17, 7.06, 7.01, 7.33, 7.04, 6.94, 7.35, 7.01, 7.54, 7.8,
7.75, 7.86, 7.58, 7.09, 7.42, 7.52, 6.69, NA, 7.69, 7.57, 7.34,
7.52, 8.18, 7.51, 7.8, 7.77, 8.07, 7.92, 6.7, 7.43, 7.58, 8.09,
7.7, 7.81, 8.11, 7.83, 7.48, 7.81, 8.27, 8.32, 7.86, 8.1, 8.63,
7.8, 5.42, 8.36, 8.08, NA, 7.78, 8.27, 8.44, 6.62, 8.01, 8.5,
7.86, 9.1, 8.15, 8.69, 8.6, 8.49, 7.98, 8.76, 8.34, 8.75, 7.97,
9.08, 8.29, NA, 8.92, 8.71, 8.94, 8.44, 9, 8.63, 9.15, 8.93,
9.37, 8.77, 9.21, 9.07, 9.1, 8.89, 7.43, 8.34, 8.64, 8.5, 9.59,
7.59, 9.08, 9.4, 9.07, 8.83, 9.46, 9.3, 9.24, 9.44, 9, 9.43,
9.17, 7.68, 9.56, 9.27, 9.33, 6.8, 9.98, 9.81, 9.59, 9.49, 9.55,
9.39, 10.04, 9.5, 9.93, 9.3, 9.49, 8.45, 7.77, 7.84, 9.88, 9.35,
10.09, 10.22, 10.75, 10.75, 8.04, 8.07, 10.14, 9.94, 10.44, 10.25,
9.49, 10.6, 8.41, 9.57, 11.25, NA, 11.61, 6.72, 10.63, 11.12,
10.55, 10.7, 10.18, 10.94, 11.02, 10.66, 10.73, 8.65, 11.84,
NA, 11.25, 11.59, 10.96, 11.58, 11.43, 12.46, 10.46, 10.99, 11.94,
8.77, 11.58, 12.36, 11, 11.05, 11.86, 9.52, 12.48, 12.39, 12.64,
12.28, 12.12, 11.27, 10.86, 12.49, 12.13, 12.74, 9.64, 10.97,
12.41, 12.32, 13.86, 13.04, NA, 10.26, 13.24, 13.89, 12.77, 13.33,
13.37, 13.55, 14.01, 14.25, 14.75, 14.3, 13.87, 14.96, 14.32,
14.49, NA, 15.41, 15.47, 14.31, 17.7, 12.48, 16.46)


aes(x = CL, y = ChH)toaes(x = x, y = y). – Effrontery