The hierarchical clustering method is based on dendrogram to determine the optimal number of clusters. Plot the dendrogram using a code similar to the following:
# General imports
import numpy as np
import matplotlib.pyplot as plt
import pandas as pd

# Special imports
from scipy.cluster.hierarchy import dendrogram, linkage

# Load data, fill in appropriately
X = []

# How to cluster the data, single is minimal distance between clusters
linked = linkage(X, 'single')

# Plot dendrogram
plt.figure(figsize=(10, 7))
dendrogram(linked,
            orientation='top',
            labels=labelList,
            distance_sort='descending',
            show_leaf_counts=True)
plt.show()
In the dendrogram locate the largest vertical difference between nodes, and in the middle pass an horizontal line. The number of vertical lines intersecting it is the optimal number of clusters (when affinity is calculated using the method set in linkage).
See example here: https://stackabuse.com/hierarchical-clustering-with-python-and-scikit-learn/
How to automatically read a dendrogram and extract that number is something I would also like to know.
Added in edit:
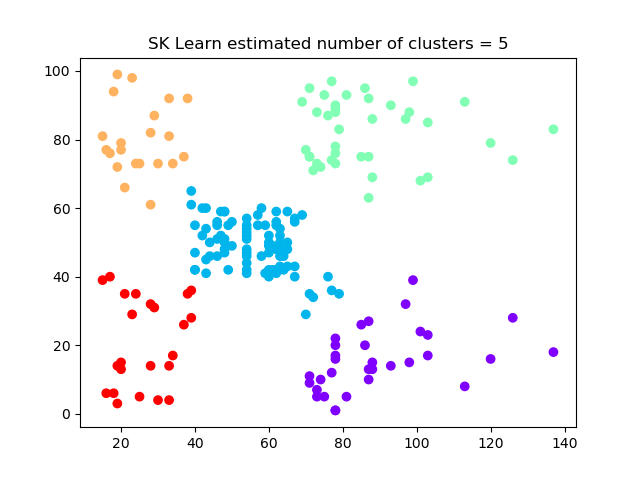
There is a way to do so using SK Learn package. See the following example:
#==========================================================================
# Hierarchical Clustering - Automatic determination of number of clusters
#==========================================================================

# General imports
import pandas as pd
import numpy as np
import matplotlib.pyplot as plt
import pandas as pd
from os import path

# Special imports
from scipy.cluster.hierarchy import dendrogram, linkage
import scipy.cluster.hierarchy as shc
from sklearn.cluster import AgglomerativeClustering

# %matplotlib inline

print("============================================================")
print("       Hierarchical Clustering demo - num of clusters       ")
print("============================================================")
print(" ")


folder = path.dirname(path.realpath(__file__)) # set current folder

# Load data
customer_data = pd.read_csv( path.join(folder, "hierarchical-clustering-with-python-and-scikit-learn-shopping-data.csv"))
# print(customer_data.shape)
print("In this data there should be 5 clusters...")

# Retain only the last two columns
data = customer_data.iloc[:, 3:5].values

# # Plot dendrogram using SciPy
# plt.figure(figsize=(10, 7))
# plt.title("Customer Dendograms")
# dend = shc.dendrogram(shc.linkage(data, method='ward'))

# plt.show()


# Initialize hiererchial clustering method, in order for the algorithm to determine the number of clusters
# put n_clusters=None, compute_full_tree = True,
# best distance threshold value for this dataset is distance_threshold = 200
cluster = AgglomerativeClustering(n_clusters=None, affinity='euclidean', linkage='ward', compute_full_tree=True, distance_threshold=200)

# Cluster the data
cluster.fit_predict(data)

print(f"Number of clusters = {1+np.amax(cluster.labels_)}")

# Display the clustering, assigning cluster label to every datapoint
print("Classifying the points into clusters:")
print(cluster.labels_)

# Display the clustering graphically in a plot
plt.scatter(data[:,0],data[:,1], c=cluster.labels_, cmap='rainbow')
plt.title(f"SK Learn estimated number of clusters = {1+np.amax(cluster.labels_)}")
plt.show()

print(" ")
![The clustering results]()
The data was taken from here: https://stackabuse.s3.amazonaws.com/files/hierarchical-clustering-with-python-and-scikit-learn-shopping-data.csv

