How can I use the gluon-cv model_zoo and output to an OpenCV window with Python?
Asked Answered
W

2

7

My code is:

import gluoncv as gcv

net = gcv.model_zoo.get_model('ssd_512_mobilenet1.0_voc', pretrained=True)

windowName = "ssdObject"
cv2.namedWindow(windowName, cv2.WINDOW_NORMAL)
cv2.resizeWindow(windowName, 1280, 720)
cv2.moveWindow(windowName, 0, 0)
cv2.setWindowTitle(windowName, "SSD Object Detection")
while True:
    # Check to see if the user closed the window
    if cv2.getWindowProperty(windowName, 0) < 0:
        # This will fail if the user closed the window; Nasties get printed to the console
        break
    ret_val, frame = video_capture.read()

    frame = mx.nd.array(cv2.cvtColor(frame, cv2.COLOR_BGR2RGB)).astype('uint8')
    rgb_nd, frame = gcv.data.transforms.presets.ssd.transform_test(frame, short=512, max_size=700)

    # # Run frame through network
    class_IDs, scores, bounding_boxes = net(rgb_nd)

    displayBuf = frame
    cv2.imshow(windowName, displayBuf)
    cv2.waitKey(0)

I somehow need to draw the bounding_codes, class_IDs, and scores onto the image and output it via imshow.

How can I accomplish this?

Windy answered 23/1, 2019 at 15:9 Comment(5)
Hmm. Not familiar with the lib, but do I guess correctly that class_IDs, scores, bounding_boxes are 3 arrays of the same length, tied together by index ids? i.e. each bounding box has an associated class_ID and score? | If so (unless there's some pre-made rendering function for this in gluoncv).... maybe just loop over the arrays and use the primitive drawing functions to draw the rectangle and two texts, maybe with randomized colours...Stenopetalous
Hmm, maybe this is the pre-made one?Stenopetalous
This looks like it uses the matlab plot rather than the OpenCV window @DanMašekWindy
Right... so I guess either cook up your own simple renderer or have matplotlib output into an in-memory image and display that with imshow... although that seems a bit over the top. Drawing it yourself should be so bad... the worst thing I can see there is fiddling about with positioning/size of the text to make it look reasonable with various sizes of bounding boxes.Stenopetalous
Could you reduce this to running on a single input image (and provide it as PNG), and a sample class_IDs, scores, bounding_boxes values? Then I can cook up a solution without installing mxnet and finding/figuring out what video to use. | BTW, you probably should store the original frame in BGR format, if you want to use it for the visualization. (or, how does gcv.data.transforms.presets.ssd.transform_test modify the frame?)Stenopetalous
A
6

We can use ssd|yolo (wroted by mxnet|keras|pytorch) to detect the objects in the image. Then we will get the result as a form of classids/scores/bboxes. Iterator the result, do some transform, then just drawing in OpenCV will be OK.

(Poor English, but I think you can get me in the following code).


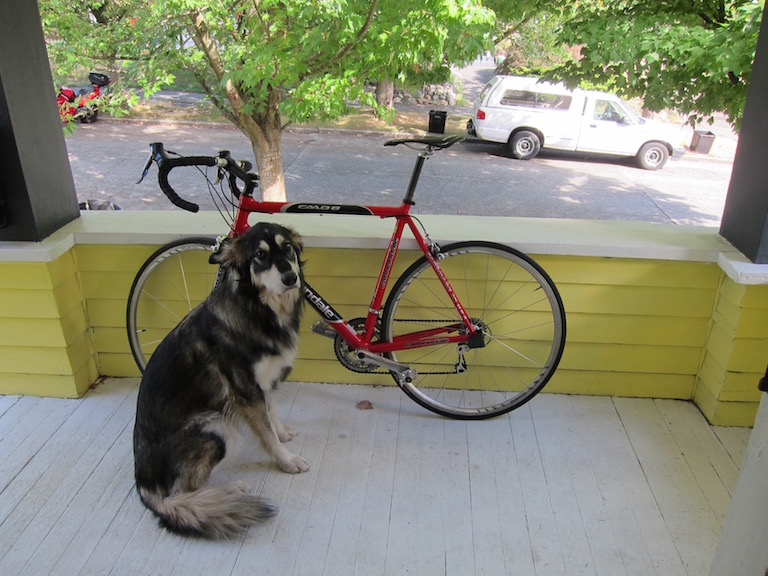
This is the source image: enter image description here

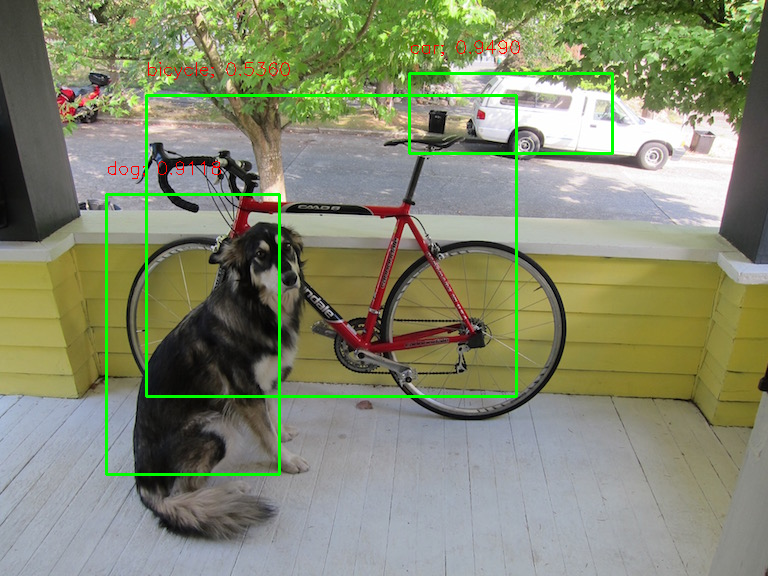
This the result displayed in OpenCV:

enter image description here


#!/usr/bin/python3
# 2019/01/24 09:05
# 2019/01/24 10:25

import gluoncv as gcv
import mxnet as mx
import cv2
import numpy as np
# https://github.com/pjreddie/darknet/blob/master/data/dog.jpg

## (1) Create network 
net = gcv.model_zoo.get_model('ssd_512_mobilenet1.0_voc', pretrained=True)

## (2) Read the image and preprocess 
img = cv2.imread("dog.jpg")
rgb = cv2.cvtColor(img, cv2.COLOR_BGR2RGB)

xrgb = mx.nd.array(rgb).astype('uint8')
rgb_nd, xrgb = gcv.data.transforms.presets.ssd.transform_test(xrgb, short=512, max_size=700)

## (3) Interface 
class_IDs, scores, bounding_boxes = net(rgb_nd)

## (4) Display 
for i in range(len(scores[0])):
    #print(class_IDs.reshape(-1))
    #print(scores.reshape(-1))
    cid = int(class_IDs[0][i].asnumpy())
    cname = net.classes[cid]
    score = float(scores[0][i].asnumpy())
    if score < 0.5:
        break
    x,y,w,h = bbox =  bounding_boxes[0][i].astype(int).asnumpy()
    print(cid, score, bbox)
    tag = "{}; {:.4f}".format(cname, score)
    cv2.rectangle(img, (x,y), (w, h), (0, 255, 0), 2)
    cv2.putText(img, tag, (x, y-20),  cv2.FONT_HERSHEY_SIMPLEX, 0.6, (0,0,255), 1)

cv2.imshow("ssd", img);
cv2.waitKey()
Aggregation answered 24/1, 2019 at 2:16 Comment(0)
S
1

GluonCV recently has included the visualization function with OpenCV.

To call these functions, you just add a cv_ prefix to your already using function. For example using cv_plot_bbox instead of plot_bbox.

Scalable answered 19/9, 2019 at 3:57 Comment(0)

© 2022 - 2024 — McMap. All rights reserved.