Is there a way to change legend to show increasing and decreasing colors for waterfall plot using Plotly (r)?
Asked Answered
R

3

7

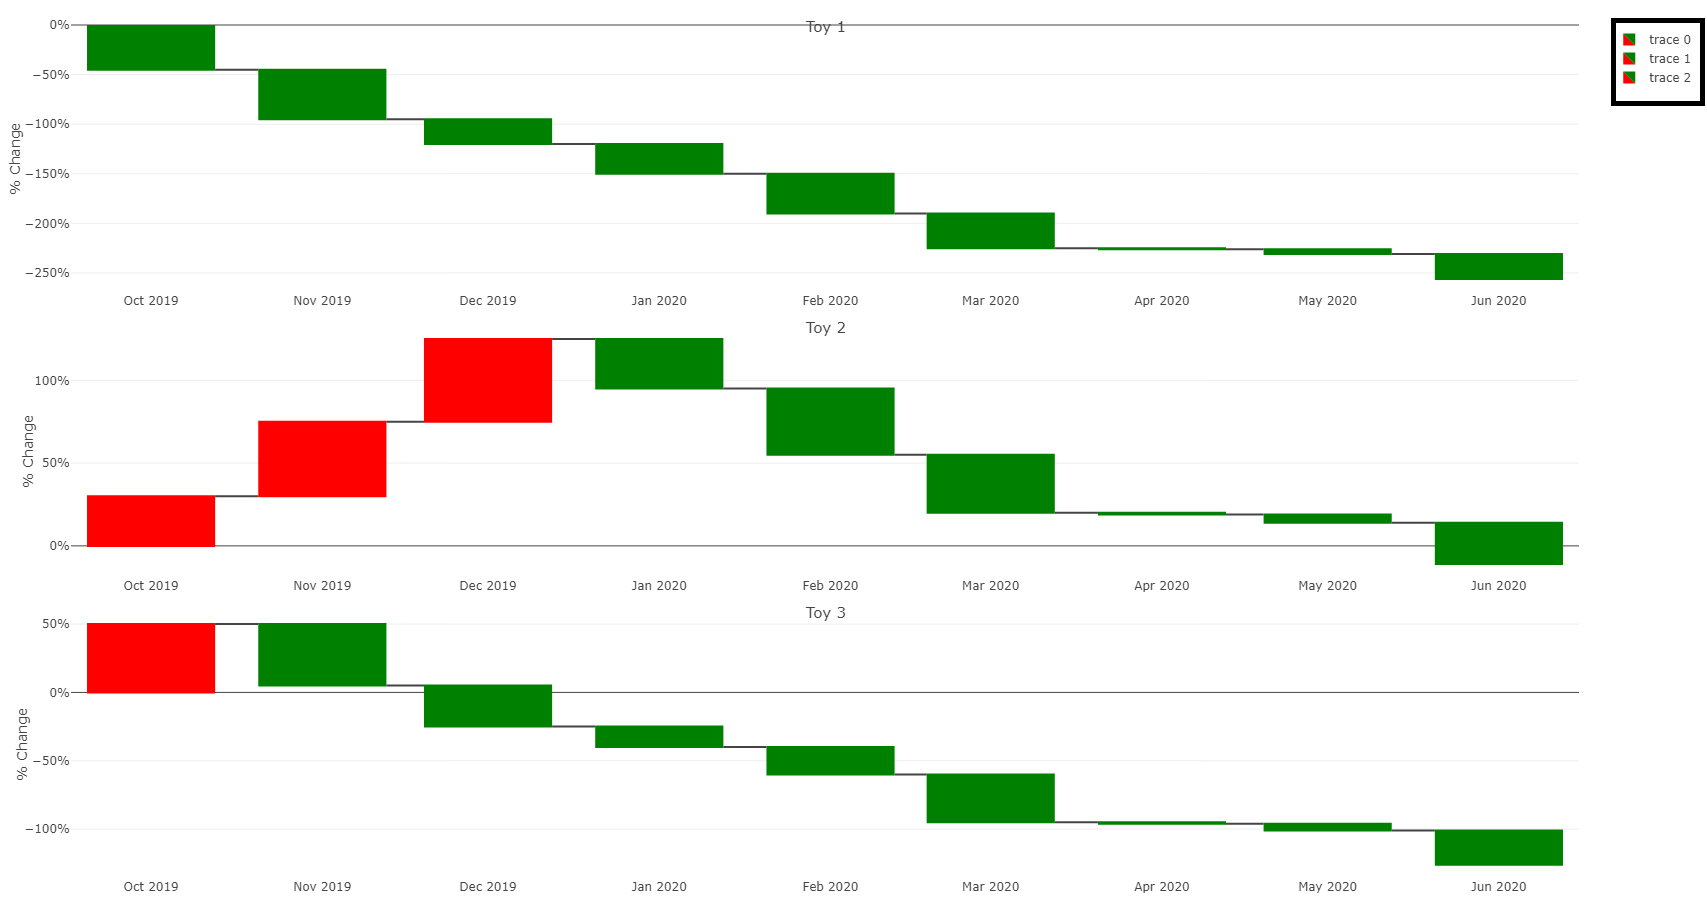
I've plotted a waterfall chart/plot using plotly. I'm trying to change the legend so that it displays the increasing/decreasing colors (red/green) that I've set. Does anyone know how I would go about doing this? I'm try display only one legend for the entire figure rather than one legend for each subplot. Currently, what displays is the trace with a red and green box (as I've indicated in the picture).

enter image description here

Here is the data:

structure(list(Date = structure(c(1569888000, 1572566400, 1575158400, 
1577836800, 1580515200, 1583020800, 1585699200, 1588291200, 1590969600, 
1569888000, 1572566400, 1575158400, 1577836800, 1580515200, 1583020800, 
1585699200, 1588291200, 1590969600, 1569888000, 1572566400, 1575158400, 
1577836800, 1580515200, 1583020800, 1585699200, 1588291200, 1590969600
), class = c("POSIXct", "POSIXt"), tzone = "UTC"), Percent_change = c(-45, 
-50, -25, -30, -40, -35, -1, -5, -25, 30, 45, 50, -30, -40, -35, 
-1, -5, -25, 50, -45, -30, -15, -20, -35, -1, -5, -25), Toys = c("Toy 1", 
"Toy 1", "Toy 1", "Toy 1", "Toy 1", "Toy 1", "Toy 1", "Toy 1", 
"Toy 1", "Toy 2", "Toy 2", "Toy 2", "Toy 2", "Toy 2", "Toy 2", 
"Toy 2", "Toy 2", "Toy 2", "Toy 3", "Toy 3", "Toy 3", "Toy 3", 
"Toy 3", "Toy 3", "Toy 3", "Toy 3", "Toy 3")), class = c("tbl_df", 
"tbl", "data.frame"), row.names = c(NA, -27L))  

Here is the code:

  percent <- function(x, digits = 2, format = "f", ...) {
  paste0(formatC(x, format = format, digits = digits, ...), "%")
}
      my_plot <- . %>% 
  plot_ly(x = ~Date, y = ~Percent_change, type = "waterfall",
          hoverinfo = "text",
          hovertext = ~paste("Date :", Date,
                             "<br> % Change:", percent(Percent_change)),
          increasing = list(marker = list(color = "red")),
          decreasing = list(marker = list(color = "green")),
          totals = list(marker = list(color = "blue")),
          textposition = "outside", legendgroup = "trace 1") %>%
  add_annotations(
    text = ~unique(Toys),
    x = 0.5,
    y = 1,
    yref = "paper",
    xref = "paper",
    xanchor = "middle",
    yanchor = "top",
    showarrow = FALSE,
    font = list(size = 15),
    yshift = 10
  )  %>%
  layout(yaxis = list(title = "% Change",
                      ticksuffix = "%"),
         xaxis = list(title = c("Date")),
         showlegend =T)


example_data %>%
  dplyr::filter(!is.na(Date)) %>% 
  group_by(Toys) %>%
  distinct()  %>%
  do(p = my_plot(.)) %>%
  subplot(nrows = 3, shareX = FALSE, titleY= TRUE, titleX= FALSE) 

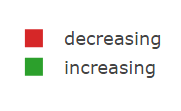
I would like the legend to specifically look like this with the title "Trend" above:

enter image description here

Readymix answered 1/2, 2023 at 18:22 Comment(3)
When I run your code, I can't see the legend?Yasmin
The legend displays for me. Maybe you have showLegend = FALSE ?Readymix
@Yasmin It should work now. There was a function that I didn't include by mistake.Readymix
P
4

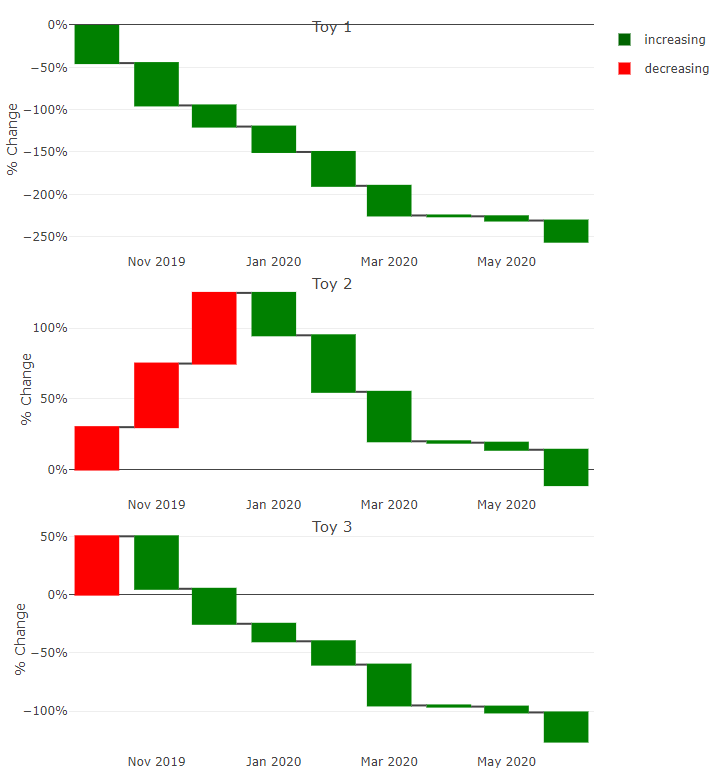
We can create two initial traces representing the two legend items.

After that we need to assign all increasing and decreasing traces into the legendgroups introduced with the initial traces and hide their legend items:

library(plotly)
library(dplyr)
library(data.table)

example_data <- structure(list( Date = structure(c(1569888000, 1572566400,
1575158400, 1577836800, 1580515200, 1583020800, 1585699200, 1588291200,
1590969600, 1569888000, 1572566400, 1575158400, 1577836800, 1580515200,
1583020800, 1585699200, 1588291200, 1590969600, 1569888000, 1572566400,
1575158400, 1577836800, 1580515200, 1583020800, 1585699200, 1588291200,
1590969600), class = c("POSIXct",  "POSIXt"), tzone = "UTC"), Percent_change =
c(-45, -50, -25, -30, -40, -35, -1, -5, -25, 30, 45, 50, -30, -40, -35, -1,
-5, -25, 50, -45, -30, -15, -20, -35, -1, -5, -25), Toys = c("Toy 1", "Toy 1",
"Toy 1", "Toy 1", "Toy 1", "Toy 1", "Toy 1", "Toy 1", "Toy 1", "Toy 2", "Toy 2",
"Toy 2", "Toy 2", "Toy 2", "Toy 2", "Toy 2", "Toy 2", "Toy 2", "Toy 3",
"Toy 3", "Toy 3", "Toy 3", "Toy 3", "Toy 3", "Toy 3", "Toy 3", "Toy 3")),
class = c("tbl_df",  "tbl",  "data.frame"), row.names = c(NA, -27L))

percent <- function(x, digits = 2, format = "f", ...) {
  paste0(formatC(x, format = format, digits = digits, ...), "%")
}

my_plot <- . %>%
  plot_ly(
    x = ~ Date[1],
    y = 0,
    type = "bar",
    name = "increasing",
    color = I("darkgreen"),
    legendgroup = "increasing",
    showlegend = ~ all(showlegend)
  ) %>%
  add_trace(
    x = ~ Date[1],
    y = 0,
    type = "bar",
    name = "decreasing",
    color = I("red"),
    legendgroup = "decreasing",
    showlegend = ~ all(showlegend)
  ) %>%
  add_trace(
    x = ~ Date,
    y = ~ Percent_change,
    type = "waterfall",
    # split = ~ legendgroup,
    hoverinfo = "text",
    hovertext = ~ paste("Date :", Date, "<br> % Change:", percent(Percent_change)),
    increasing = list(marker = list(color = "red")),
    decreasing = list(marker = list(color = "green")),
    totals = list(marker = list(color = "blue")),
    textposition = "outside",
    legendgroup = ~ legendgroup,
    showlegend = FALSE
  ) %>%
  add_annotations(
    text = ~ unique(Toys),
    x = 0.5,
    y = 1,
    yref = "paper",
    xref = "paper",
    xanchor = "middle",
    yanchor = "top",
    showarrow = FALSE,
    font = list(size = 15),
    yshift = 10
  )  %>%
  layout(yaxis = list(title = "% Change", ticksuffix = "%"),
         xaxis = list(title = c("Date")),
         legend = list(
           itemclick = FALSE,
           itemdoubleclick = FALSE,
           groupclick = FALSE
         ))

example_data %>%
  dplyr::filter(!is.na(Date))  %>%
  mutate(legendgroup = case_when(
    Percent_change >= 0 ~ "increasing",
    Percent_change < 0 ~ "decreasing",
  )) %>%
  mutate(showlegend = data.table::rleid(Toys, legendgroup) %in% c(1, 2)) %>%
  group_by(Toys) %>%
  distinct() %>%
  do(p = my_plot(.)) %>%
  subplot(
    nrows = 3,
    shareX = FALSE,
    titleY = TRUE,
    titleX = FALSE
  )

result

PS: if you prefer to display your waterfall using separate traces for the increasing and decreasing parts use split = ~ legendgroup in the add_trace call. Furthermore you'll need to set itemclick etc. back to TRUE in the layout call for an interactive legend.

Pose answered 9/2, 2023 at 12:54 Comment(1)
I did not know this was possible - this is better than using js.Halitosis
H
2

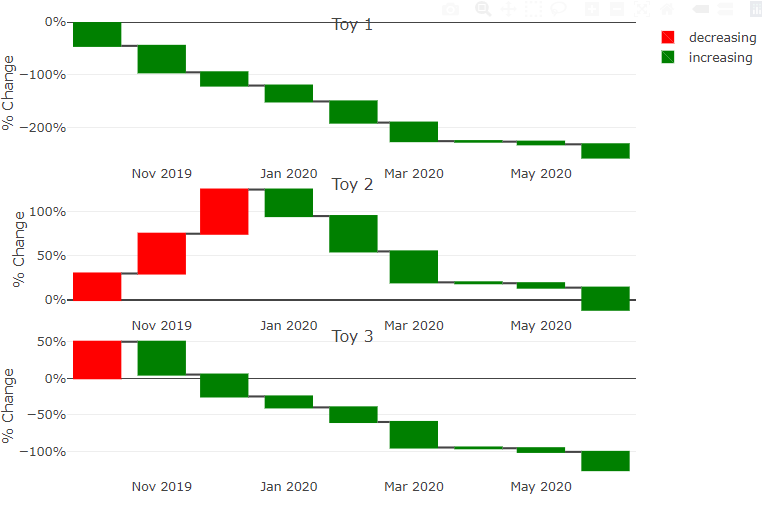
You can edit the legend name in R and use javascript to edit the legend colors

Edit: I'll leave this here as it is a different approach which is sometimes useful, but I think the answer by @ismirsehregal - which doesn't involve hacking the object created by plotly.js - is better.

Steps:

  1. Re-define your my_plot() function so that it names the first trace "decreasing" and the second one "increasing".
  2. Append some javascript to manually change the legend colors.
  3. Call the function, hiding the third legend, and appending the javascript

1. Redefine the function

This is the same as your function except it maps the first two groups to "increasing" or "decreasing".

my_plot <- function(x,
                    group_name,
                    groups_to_show_legend = c(
                        "Toy 1" = "decreasing", "Toy 2" = "increasing"
                    )) {
    x %>%
        plot_ly(
            x = ~Date, y = ~Percent_change, type = "waterfall",
            hoverinfo = "text",
            hovertext = ~ paste(
                "Date :", Date,
                "<br> % Change:", percent(Percent_change)
            ),
            increasing = list(marker = list(color = "red")),
            decreasing = list(marker = list(color = "green")),
            totals = list(marker = list(color = "blue")),
            textposition = "outside",
            legendgroup = "trace 1",
            name = groups_to_show_legend[group_name]
        ) %>%
        add_annotations(
            text = ~ unique(Toys),
            x = 0.5,
            y = 1,
            yref = "paper",
            xref = "paper",
            xanchor = "middle",
            yanchor = "top",
            showarrow = FALSE,
            font = list(size = 15),
            yshift = 10
        ) %>%
        layout(
            yaxis = list(
                title = "% Change",
                ticksuffix = "%"
            ),
            xaxis = list(title = c("Date")),
            showlegend = TRUE
        )
}

2. Append some javascript

We can define some a javascript string in R which we feed to the htmlwidget created by plotly. This makes the "decreasing" symbol red and the "increasing" symbol green.


js_text <- htmltools::HTML('
    let legend = document.querySelector(\'.scrollbox\');\n
    let symbols = legend.getElementsByClassName("legendsymbols");\n
    const re = new RegExp("fill: rgb.*?;", "ig");\n
    symbols[0].innerHTML = symbols[0].innerHTML.replaceAll(re, "fill: rgb(255, 0, 0);");\n
    symbols[1].innerHTML = symbols[1].innerHTML.replaceAll(re, "fill: rgb(0, 128, 0);");\n
')

3. Call the function, hiding the third legend, and appending the javascript

I've replaced do(), which is deprecated, with split() followed by purrr::imap(). This also allows us to supply the group names to the function:

example_data |>
    dplyr::filter(!is.na(Date)) |>
    group_by(Toys) |>
    distinct() |>
    split(~Toys) |>
    purrr::imap(my_plot) |>
    subplot(
        nrows = 3,
        shareX = FALSE,
        titleY = TRUE,
        titleX = FALSE
    ) |>
    style(showlegend = FALSE, traces = 3)  |>
    htmlwidgets::prependContent(
        htmlwidgets::onStaticRenderComplete(js_text)
    )

We use htmlwidgets::prependContent() to attach this code to the plotly object, and htmlwidgets::onStaticRenderComplete() to ensure that it runs once the object is loaded.

enter image description here

Halitosis answered 9/2, 2023 at 11:20 Comment(0)
Y
1

You could use style to remove multiple traces. This creates one legend for your graph like this:

library(plotly)
library(dplyr)
my_plot <- . %>% 
  plot_ly(x = ~Date, y = ~Percent_change, type = "waterfall",
          hoverinfo = "text",
          hovertext = ~paste("Date :", Date,
                             "<br> % Change:", percent(Percent_change)),
          increasing = list(marker = list(color = "red")),
          decreasing = list(marker = list(color = "green")),
          totals = list(marker = list(color = "blue")),
          textposition = "outside", legendgroup = "trace 1") %>%
  add_annotations(
    text = ~unique(Toys),
    x = 0.5,
    y = 1,
    yref = "paper",
    xref = "paper",
    xanchor = "middle",
    yanchor = "top",
    showarrow = FALSE,
    font = list(size = 15),
    yshift = 10
  )  %>%
  layout(yaxis = list(title = "% Change",
                      ticksuffix = "%"),
         xaxis = list(title = c("Date")),
         showlegend = TRUE)


example_data %>%
  dplyr::filter(!is.na(Date)) %>% 
  group_by(Toys) %>%
  distinct()  %>%
  do(p = my_plot(.)) %>%
  subplot(nrows = 3, shareX = FALSE, titleY= TRUE, titleX= FALSE) %>%
  style(showlegend = FALSE, traces = c(1,2))

Created on 2023-02-08 with reprex v2.0.2

Yasmin answered 8/2, 2023 at 20:12 Comment(1)
Sorry, I edited my question to make it more clear what I'm looking for.Readymix

© 2022 - 2024 — McMap. All rights reserved.