Key Points:
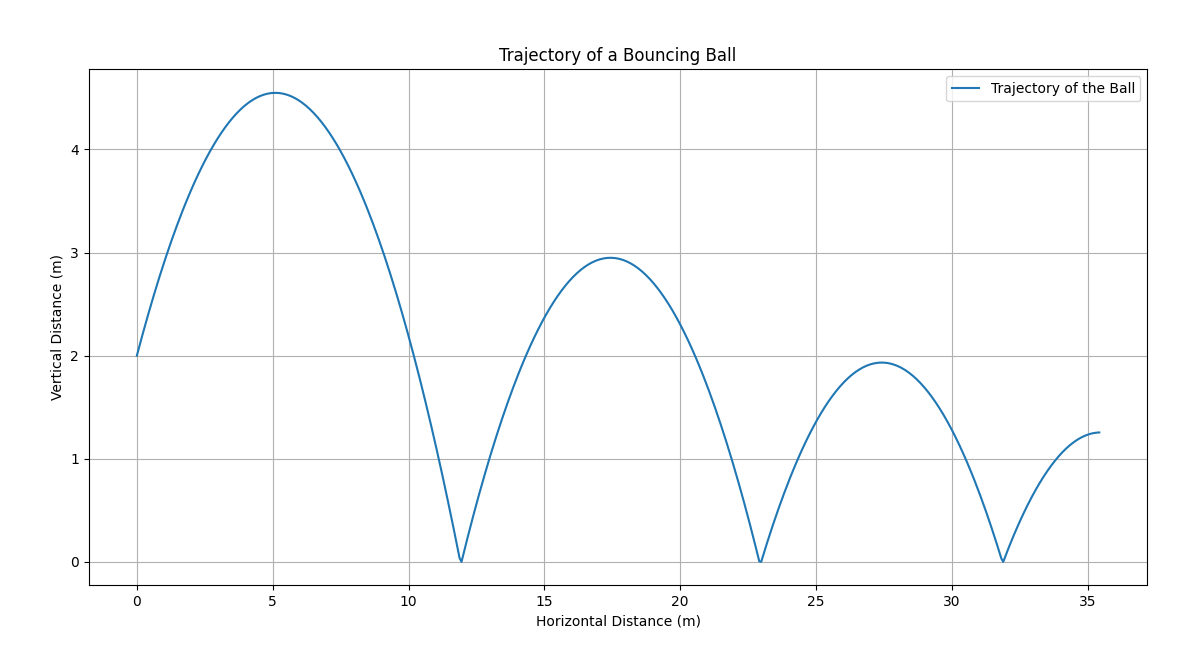
- I have a default ball trajectory generated using some code(provided below). Lets name this trajectory Initial Trajectory.
- Next I have an actual ball whose trajectory I need to estimate.
- Now I need to improve the Initial Trajectory iteratively (to better represent actual ball trajectory) based on the coordinates of the actual ball as it moves through the environment.
- For example lets say after 5 units of time, I have 5 positions of where the actual ball has been through. Now I need to uses these 5 points and the Initial Trajectory to predict the future trajectory of the actual ball. I am expecting the actual trajectory to improve with time as more positions of the actual ball comes in.
Initial Trajectory Visualization:

Initial Trajectory Code:
import numpy as np
import matplotlib.pyplot as plt

# Constants
g = 9.81  # gravity (m/s^2)
e = 0.8  # coefficient of restitution
theta = np.radians(45)  # launch angle (radians)
v0 = 10  # initial velocity (m/s)
x0, y0 = 0, 2  # initial position (m)
vx0 = v0 * np.cos(theta)  # initial horizontal velocity (m/s)
vy0 = v0 * np.sin(theta)  # initial vertical velocity (m/s)
t_step = 0.01  # time step for simulation (s)
t_max = 5  # max time for simulation (s)

# Initialize lists to store trajectory points
x_vals = [x0]
y_vals = [y0]

# Simulation loop
t = 0
x, y = x0, y0
vx, vy = vx0, vy0

while t < t_max:
    t += t_step
    x += vx * t_step
    y += vy * t_step - 0.5 * g * t_step ** 2
    vy -= g * t_step

    if y <= 0:  # Ball hits the ground
        y = 0
        vy = -e * vy

    x_vals.append(x)
    y_vals.append(y)

    if len(x_vals) > 1 and x_vals[-1] == x_vals[-2] and y_vals[-1] == y_vals[-2]:
        break  # Stop simulation if ball stops bouncing

# Plotting the trajectory
plt.figure(figsize=(10, 5))
plt.plot(x_vals, y_vals, label="Trajectory of the Ball")
plt.xlabel("Horizontal Distance (m)")
plt.ylabel("Vertical Distance (m)")
plt.title("Trajectory of a Bouncing Ball")
plt.legend()
plt.grid(True)
plt.show()
QUESTION:
- How can I combine a default bouncing ball trajectory and some coordinates of actual ball trajectory to predict the future trajectory of the actual ball.
NOTE:
- I am going with this method of trajectory approximation to better represent real world ball trajectory without having to fine tune complex parameters like energy loss on ball bounce, friction, type of floor, ball elasticity etc.
EDIT_1:
Actual Ball Trajectory Data:
X: [7.410000e-03 9.591000e-02 2.844100e-01 5.729100e-01 9.614100e-01
 1.449910e+00 2.038410e+00 2.726910e+00 3.373700e+00 4.040770e+00
 4.800040e+00 5.577610e+00 6.355180e+00 7.132750e+00 7.910320e+00
 8.687900e+00 9.465470e+00 1.020976e+01 1.092333e+01 1.163690e+01
 1.235047e+01 1.306404e+01 1.377762e+01 1.449119e+01]
Y: [2.991964 2.903274 2.716584 2.431894 2.049204 1.568514 0.989824 0.313134
 0.311512 0.646741 0.88397  1.0232   1.064429 1.007658 0.852887 0.600116
 0.249345 0.232557 0.516523 0.702488 0.790454 0.78042  0.672385 0.466351]
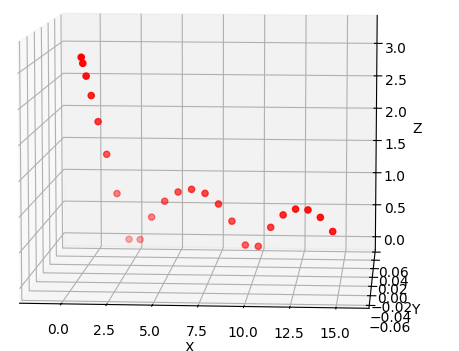
Graph(Actual Ball Trajectory):
- Note the ball being dropped from a certain height with some horizontal velocity.
- The graph is in 3D but I have simplified the data points to be 2D only (one of the axis is always zero) to keep the problem simpler.
EDIT_2:
I made use of scipy.optimize() with default method. Got the following output:
What I observed(looking at the image above) that there is some loss in horizontal velocity after bounce, which I was not considering. I thought there was only loss of vertical velocity. Here is the relevant code for the graph above:
import numpy as np
import matplotlib.pyplot as plt
from scipy.optimize import minimize

# actually y
act_x = np.array([0.019053200000000013, 0.08770320000000008, 0.1850550000000004, 0.2825550000000008, 0.38005500000000114, 0.4775550000000015, 0.5750549999999806, 0.6725549999999532, 0.7700549999999258, 0.8675549999998984, 0.965054999999871, 1.0625549999998436, 1.1600549999998162, 1.2575549999997888, 1.3550549999997614, 1.452554999999734, 1.5500549999997066, 1.6475549999996792, 1.7450549999996519, 1.8425549999996245, 1.940054999999597, 2.0375549999996125, 2.1234107142854164, 2.193053571428365, 2.2626964285713136, 2.332339285714262, 2.401982142857211, 2.4716250000001594, 2.541267857143108, 2.6109107142860566, 2.680553571429005, 2.750196428571954, 2.8198392857149024, 2.889482142857851, 2.9591250000007996, 3.028767857143748, 3.098410714286697, 3.1680535714296454, 3.237696428572594, 3.3073392857155426, 3.376982142858491, 3.44662500000144, 3.5162678571443884, 3.585910714287337, 3.6555535714302856, 3.725196428573234, 3.794839285716183, 3.8644821428591314, 3.93412500000208, 4.003767857145029, 4.073410714287977, 4.143053571430926, 4.212696428573874, 4.282339285716823, 4.351982142859772, 4.42162500000272, 4.491267857145669, 4.560910714288617, 4.630553571431566, 4.700196428574515, 4.769839285717463, 4.839482142860412, 4.90912500000336, 4.978767857146309, 5.048410714289258, 5.118053571432206, 5.187696428575155, 5.257339285718103, 5.326982142861052, 5.396625000004001, 5.466267857146949, 5.535910714289898, 5.605553571432846, 5.675196428575795, 5.744839285718744, 5.814482142861692, 5.884125000004641, 5.953767857147589, 6.023410714290538, 6.093053571433487, 6.162696428576435, 6.232339285719384, 6.301982142862332, 6.371625000005281, 6.44126785714823, 6.510910714291178, 6.580553571434127, 6.650196428577075, 6.719839285720024, 6.789482142862973, 6.859125000005921, 6.92876785714887, 6.998410714291818, 7.068053571434767, 7.137696428577716, 7.207339285720664, 7.276982142863613, 7.346625000006561, 7.41626785714951, 7.485910714292459, 7.555553571435407, 7.625196428578356, 7.694839285721304, 7.764482142864253])
# actually z
act_y = np.array([1.0379079699999998, 1.1754534700000003, 1.3602534700000006, 1.5209239699999955, 1.6570944699999859, 1.7687649699999706, 1.8559354699999533, 1.9186059699999365, 1.95677646999992, 1.970446969999904, 1.9596174699998887, 1.9242879699998736, 1.8644584699998585, 1.7801289699998444, 1.6712994699998283, 1.537969969999807, 1.3801404699997812, 1.19781096999975, 0.9909814699997134, 0.7596519699996719, 0.5038224699996257, 0.22349296999957416, 0.13930352847394978, 0.3499050645343172, 0.5360066005946793, 0.6976081366550367, 0.8347096727153887, 0.9473112087757359, 1.0354127448360804, 1.0990142808964258, 1.1381158169567716, 1.1527173530171173, 1.1428188890774638, 1.1084204251378103, 1.0495219611981568, 0.9661234972585043, 0.8582250333188504, 0.7258265693791917, 0.5689281054395274, 0.3875296414998584, 0.18163117756018424, 0.11887053865291446, 0.2798887215524012, 0.41640690445188283, 0.5284250873513592, 0.6159432702508338, 0.6789614531503088, 0.7174796360497837, 0.7314978189492595, 0.7210160018487353, 0.6860341847482112, 0.6265523676476875, 0.5425705505471646, 0.4340887334466397, 0.3011069163461103, 0.14362509924557573, 0.10758844178113687, 0.2208353837910192, 0.309582325800899, 0.37382926781077935, 0.41357620982065996, 0.42882315183054115, 0.4195700938404224, 0.385817035850304, 0.3275639778601862, 0.24481091987006875, 0.13755786187995, 0.07905142871570557, 0.1646809455657065, 0.22581046241570793, 0.2624399792657099, 0.2745694961157122, 0.26219901296571463, 0.2253285298157173, 0.16395804666572056, 0.07808756351572432, 0.09996825173824968, 0.1511630228129375, 0.17785779388762588, 0.1800525649623144, 0.15774733603700322, 0.11094210711169239, 0.05563702598852237, 0.09995862508974714, 0.11978022419097237, 0.1151018232921977, 0.08592342239342333, 0.06022248147389577, 0.08484848858531084, 0.0849744956967261, 0.06060050280814157, 0.06605277311641561, 0.06792022730639775, 0.05243051383233173, 0.060240252169206004, 0.0532114047328211, 0.05285089806699147, 0.052793140813351076, 0.05130362411928389, 0.05057861286791727, 0.049998536419320685, 0.049997973905616416, 0.049997920093917625, 0.049997920094010155])

def get_initial_trajectory(e_1=0.8):
    # Constants
    g = 9.81  # gravity (m/s^2)
    e = e_1 #0.8  # coefficient of restitution
    theta = np.radians(45)  # launch angle (radians)
    v0 = 10  # initial velocity (m/s)
    x0, y0 = 0, 1  # initial position (m)
    #vx0 = (v0 * np.cos(theta))*-1  # initial horizontal velocity (m/s)
    #vy0 = v0 * np.sin(theta)  # initial vertical velocity (m/s)

    vx0 = 1.95
    vy0 = 4.4

    t_step = 0.01  # time step for simulation (s)
    t_max = 5  # max time for simulation (s)

    # Initialize lists to store trajectory points
    x_vals = [x0]
    y_vals = [y0]

    # Simulation loop
    t = 0
    x, y = x0, y0
    vx, vy = vx0, vy0

    while t < t_max:
        t += t_step
        x += vx * t_step
        y += vy * t_step - 0.5 * g * t_step ** 2
        vy -= g * t_step

        if y <= 0:  # Ball hits the ground
            y = 0
            vy = -e * vy

        x_vals.append(x)
        y_vals.append(y[0] if isinstance(y, np.ndarray) else y )

        if len(x_vals) > 1 and x_vals[-1] == x_vals[-2] and y_vals[-1] == y_vals[-2]:
            break  # Stop simulation if ball stops bouncing

    return x_vals, y_vals

def cost_function(params):
    e_1 = params
    x_vals, y_vals = get_initial_trajectory(e_1)

    print(x_vals)
    print(y_vals)
    y_temp = np.interp(act_x, x_vals, y_vals)

    return np.sum((act_y - y_temp)**2)


param = np.array([0.8])

output = minimize(cost_function, param, bounds=[(None, None)])

print("Tuned Coefficient of Restitution: ", output)

x_vals, y_vals = get_initial_trajectory(0.8)
x_vals_new, y_vals_new = get_initial_trajectory(7.207e-01)

# Plotting the trajectory
plt.figure(figsize=(10, 5))
plt.plot(x_vals, y_vals, label="Initial Trajectory")
plt.scatter(act_x, act_y, color='r', label='Observed')
plt.plot(x_vals_new, y_vals_new, label="Output Trajectory", color="orange")
plt.xlabel("Horizontal Distance (m)")
plt.ylabel("Vertical Distance (m)")
plt.title("Trajectory of a Bouncing Ball")
plt.legend()
plt.grid(True)
plt.show()
To correct this, I added a parameter q for loss in horizontal velocity. And made some changes in code after bounce:
Before Code:
if y <= 0:  # Ball hits the ground
    y = 0
    vy = -e * vy
After Code:
if y <= 0:  # Ball hits the ground
    y = 0
    vy = -e * vy
    vx = vx * q    # Added
This change seems to improve the output(The red and orange line seems more aligned especially for the first 2 bumps):
Here is the updated code:
import numpy as np
import matplotlib.pyplot as plt
from scipy.optimize import minimize

# actually y
act_x = np.array([0.019053200000000013, 0.08770320000000008, 0.1850550000000004, 0.2825550000000008, 0.38005500000000114, 0.4775550000000015, 0.5750549999999806, 0.6725549999999532, 0.7700549999999258, 0.8675549999998984, 0.965054999999871, 1.0625549999998436, 1.1600549999998162, 1.2575549999997888, 1.3550549999997614, 1.452554999999734, 1.5500549999997066, 1.6475549999996792, 1.7450549999996519, 1.8425549999996245, 1.940054999999597, 2.0375549999996125, 2.1234107142854164, 2.193053571428365, 2.2626964285713136, 2.332339285714262, 2.401982142857211, 2.4716250000001594, 2.541267857143108, 2.6109107142860566, 2.680553571429005, 2.750196428571954, 2.8198392857149024, 2.889482142857851, 2.9591250000007996, 3.028767857143748, 3.098410714286697, 3.1680535714296454, 3.237696428572594, 3.3073392857155426, 3.376982142858491, 3.44662500000144, 3.5162678571443884, 3.585910714287337, 3.6555535714302856, 3.725196428573234, 3.794839285716183, 3.8644821428591314, 3.93412500000208, 4.003767857145029, 4.073410714287977, 4.143053571430926, 4.212696428573874, 4.282339285716823, 4.351982142859772, 4.42162500000272, 4.491267857145669, 4.560910714288617, 4.630553571431566, 4.700196428574515, 4.769839285717463, 4.839482142860412, 4.90912500000336, 4.978767857146309, 5.048410714289258, 5.118053571432206, 5.187696428575155, 5.257339285718103, 5.326982142861052, 5.396625000004001, 5.466267857146949, 5.535910714289898, 5.605553571432846, 5.675196428575795, 5.744839285718744, 5.814482142861692, 5.884125000004641, 5.953767857147589, 6.023410714290538, 6.093053571433487, 6.162696428576435, 6.232339285719384, 6.301982142862332, 6.371625000005281, 6.44126785714823, 6.510910714291178, 6.580553571434127, 6.650196428577075, 6.719839285720024, 6.789482142862973, 6.859125000005921, 6.92876785714887, 6.998410714291818, 7.068053571434767, 7.137696428577716, 7.207339285720664, 7.276982142863613, 7.346625000006561, 7.41626785714951, 7.485910714292459, 7.555553571435407, 7.625196428578356, 7.694839285721304, 7.764482142864253])
# actually z
act_y = np.array([1.0379079699999998, 1.1754534700000003, 1.3602534700000006, 1.5209239699999955, 1.6570944699999859, 1.7687649699999706, 1.8559354699999533, 1.9186059699999365, 1.95677646999992, 1.970446969999904, 1.9596174699998887, 1.9242879699998736, 1.8644584699998585, 1.7801289699998444, 1.6712994699998283, 1.537969969999807, 1.3801404699997812, 1.19781096999975, 0.9909814699997134, 0.7596519699996719, 0.5038224699996257, 0.22349296999957416, 0.13930352847394978, 0.3499050645343172, 0.5360066005946793, 0.6976081366550367, 0.8347096727153887, 0.9473112087757359, 1.0354127448360804, 1.0990142808964258, 1.1381158169567716, 1.1527173530171173, 1.1428188890774638, 1.1084204251378103, 1.0495219611981568, 0.9661234972585043, 0.8582250333188504, 0.7258265693791917, 0.5689281054395274, 0.3875296414998584, 0.18163117756018424, 0.11887053865291446, 0.2798887215524012, 0.41640690445188283, 0.5284250873513592, 0.6159432702508338, 0.6789614531503088, 0.7174796360497837, 0.7314978189492595, 0.7210160018487353, 0.6860341847482112, 0.6265523676476875, 0.5425705505471646, 0.4340887334466397, 0.3011069163461103, 0.14362509924557573, 0.10758844178113687, 0.2208353837910192, 0.309582325800899, 0.37382926781077935, 0.41357620982065996, 0.42882315183054115, 0.4195700938404224, 0.385817035850304, 0.3275639778601862, 0.24481091987006875, 0.13755786187995, 0.07905142871570557, 0.1646809455657065, 0.22581046241570793, 0.2624399792657099, 0.2745694961157122, 0.26219901296571463, 0.2253285298157173, 0.16395804666572056, 0.07808756351572432, 0.09996825173824968, 0.1511630228129375, 0.17785779388762588, 0.1800525649623144, 0.15774733603700322, 0.11094210711169239, 0.05563702598852237, 0.09995862508974714, 0.11978022419097237, 0.1151018232921977, 0.08592342239342333, 0.06022248147389577, 0.08484848858531084, 0.0849744956967261, 0.06060050280814157, 0.06605277311641561, 0.06792022730639775, 0.05243051383233173, 0.060240252169206004, 0.0532114047328211, 0.05285089806699147, 0.052793140813351076, 0.05130362411928389, 0.05057861286791727, 0.049998536419320685, 0.049997973905616416, 0.049997920093917625, 0.049997920094010155])

def get_initial_trajectory(e_1=0.8, q_1=1):
    # Constants
    g = 9.81  # gravity (m/s^2)
    e = e_1 #0.8  # coefficient of restitution
    q = q_1     # Horizontal velocity coefficient
    theta = np.radians(45)  # launch angle (radians)
    v0 = 10  # initial velocity (m/s)
    x0, y0 = 0, 1  # initial position (m)
    #vx0 = (v0 * np.cos(theta))*-1  # initial horizontal velocity (m/s)
    #vy0 = v0 * np.sin(theta)  # initial vertical velocity (m/s)

    vx0 = 1.95
    vy0 = 4.4

    t_step = 0.01  # time step for simulation (s)
    t_max = 5  # max time for simulation (s)

    # Initialize lists to store trajectory points
    x_vals = [x0]
    y_vals = [y0]

    # Simulation loop
    t = 0
    x, y = x0, y0
    vx, vy = vx0, vy0

    while t < t_max:
        t += t_step
        x += vx * t_step
        y += vy * t_step - 0.5 * g * t_step ** 2
        vy -= g * t_step

        if y <= 0:  # Ball hits the ground
            y = 0
            vy = -e * vy

            vx = vx * q    # Added

        x_vals.append(x)
        y_vals.append(y[0] if isinstance(y, np.ndarray) else y )

        if len(x_vals) > 1 and x_vals[-1] == x_vals[-2] and y_vals[-1] == y_vals[-2]:
            break  # Stop simulation if ball stops bouncing

    return x_vals, y_vals

def cost_function(params):
    e_1, q_1 = params
    x_vals, y_vals = get_initial_trajectory(e_1, q_1)

    print(x_vals)
    print(y_vals)
    y_temp = np.interp(act_x, x_vals, y_vals)

    return np.sum((act_y - y_temp)**2)


param = np.array([0.8, 1])

output = minimize(cost_function, param, bounds=[(None, None)])

print("Tuned Coefficient of Restitution: ", output)

x_vals, y_vals = get_initial_trajectory(0.8, 1)
x_vals_new, y_vals_new = get_initial_trajectory(output.x[0], output.x[1])

# Plotting the trajectory
plt.figure(figsize=(10, 5))
plt.plot(x_vals, y_vals, label="Initial Trajectory")
plt.scatter(act_x, act_y, color='r', label='Actual Ball Trajectory')
plt.plot(x_vals_new, y_vals_new, label="Output Trajectory", color="orange")
plt.xlabel("Horizontal Distance (m)")
plt.ylabel("Vertical Distance (m)")
plt.title("Trajectory of a Bouncing Ball")
plt.legend()
plt.grid(True)
plt.show()
But the results are not perfect. The orange line does not completely overlaps the red dotted line.
Now I am completely lost of what to do next:
- Shall I use better optimizer (like what @Bill mentioned GEKKO, CasADi, Pyomo)?
- Or change the formula to add more parameters(as it helped in the last change)?


EDIT_2section. The frequency of data is 20 Hertz(20 times a second as ball moves). Earlier it was 10 Hertz. – Vocative