Spring Data JPA Meta JpaMetamodelMappingContext Memory Consumption
Asked Answered
P

1

7

My Spring Data JPA/Hibernate Application consumes over 2GB of memory at start without a single user hitting it. I am using Hazelcast as the second level cache but I had the same issue when I used ehCache as well so that is probably not the cause of the issue.

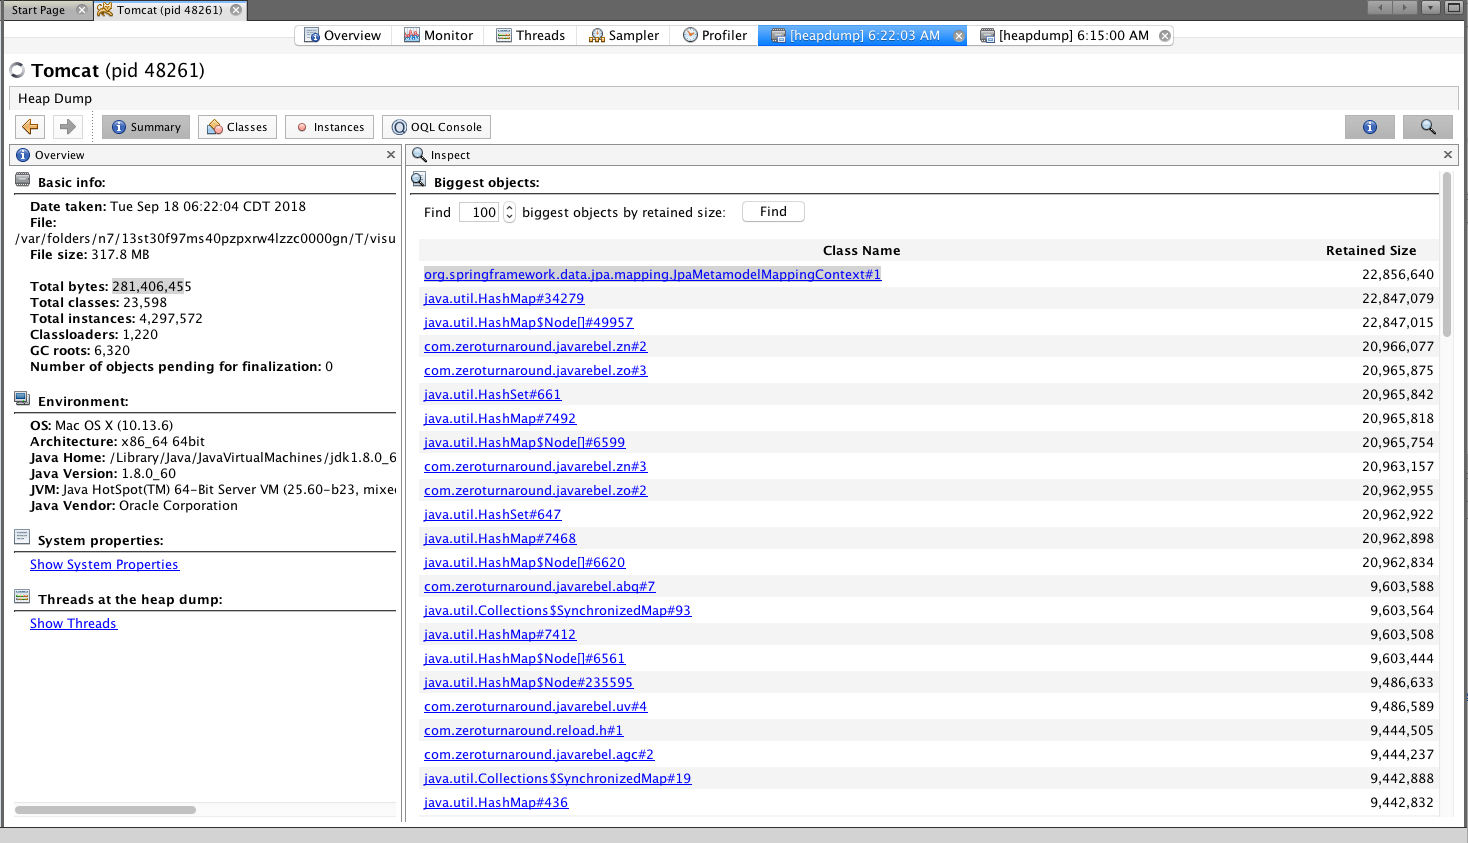
I ran a profile with a Heap Dump in Visual VM and I see where the bulk of the memory is being consumed by JpaMetamodelMappingContext and secondary a ton of Map objects. I just need help in deciphering what I am seeing and if this is actually a problem. I do have a hundred classes in the model so this may be normal but I have no point of reference. It just seems a bit excessive.

Once I get a load of 100 concurrent users, my memory consumption increases to 6-7 GB. That is quite normal for the amount of data I push around and cache, but I feel like if I could reduce the initial memory, I'd have a lot more room for growth.

Screenshot of Visual VM

enter image description here

Photocompose answered 18/9, 2018 at 11:49 Comment(0)
G
8

I don't think you have a problem here. Instead, I think you are misinterpreting the data you are looking at.

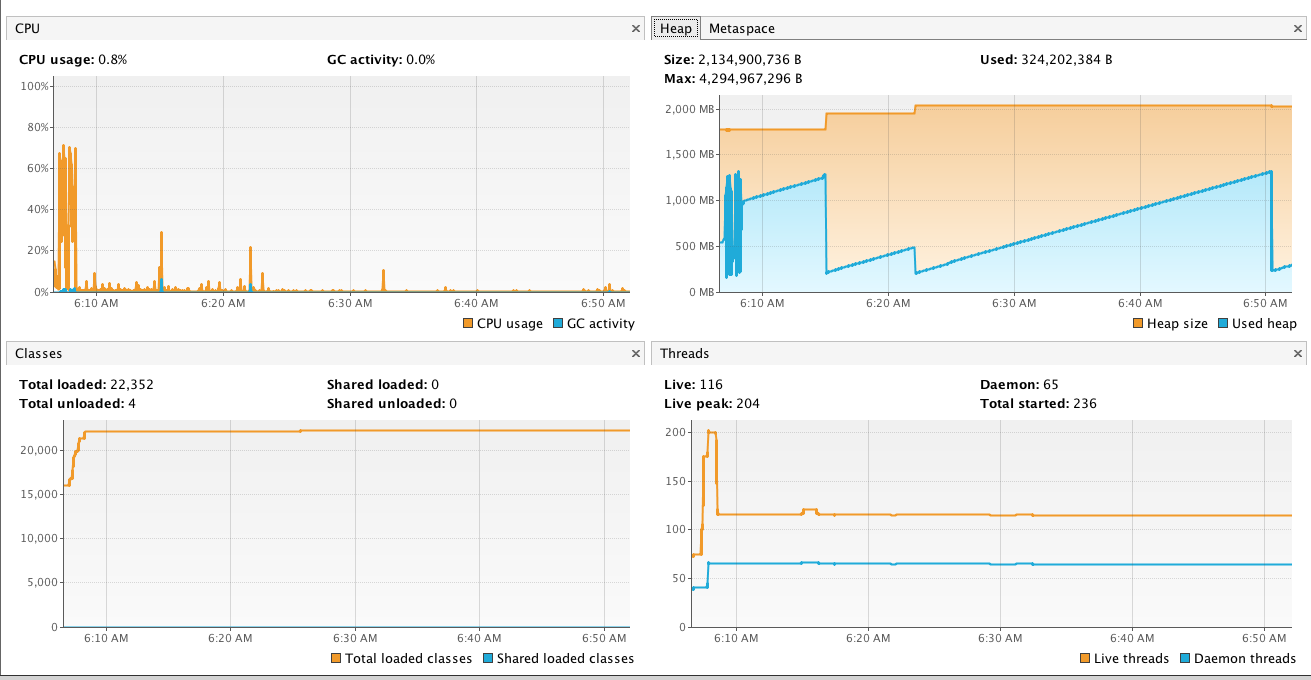
Note that the heap space diagram displays two numbers: Heap size and Used heap

Heap size (orange) is the amount of memory available to the JVM for the heap. This means it is the amount that the JVM requested at some point from the OS.

Used heap is the part of the Heap size that is actually used. Ignoring the startup phase, it grows linear and then drops repeatedly over time. This is typical behavior of an idling application. Some part of the application generates a moderate amount of garbage (rising part of the curve) which from time to time gets collected.

The low points of that curve are the amount of memory you are actually really using. It seems to be about 250MB which doesn't sound very much to me, especially when you say that the total consumption of 6-7GB when actually working sounds reasonable to you.

Some other observations:

Both CPU load and heap grows fast/fluctuates a lot at start time. This is to be expected because the analysis of repositories and entities happen at that time.

JpaMetamodelMappingContext s retained size is about 23MB. Again, a good chunk of memory, but not that huge. This includes the stuff it references, which is almost exclusively metadata from the JPA implementation as you can easily see when you take a look at its source.

Genitor answered 30/9, 2018 at 12:34 Comment(4)
No matter how long, it is idle, usage never drops below 2gb of memory. You'd think that it would become much lower than that. I am not storing anything in memory, caches are short lived.Photocompose
Not sure what you are talking about. Usage drops down to 250-300MB on every GC cycle.Genitor
In my app, I never see the memory consumption drop below 2gb of memory even if it is idle for a long period of time.Photocompose
what Jens is trying to tell you is that your app is reserving 2Gb from the system because at startup he needed that. After the initial workload the garbage collector take care of reducing the memory needed BUT the jvm is smart enough to keep the 2Gb reserved because it will probably be needed later. From a system view Jvm is using 2Gb constantly but actually only 300 mb is used.Hiss

© 2022 - 2024 — McMap. All rights reserved.