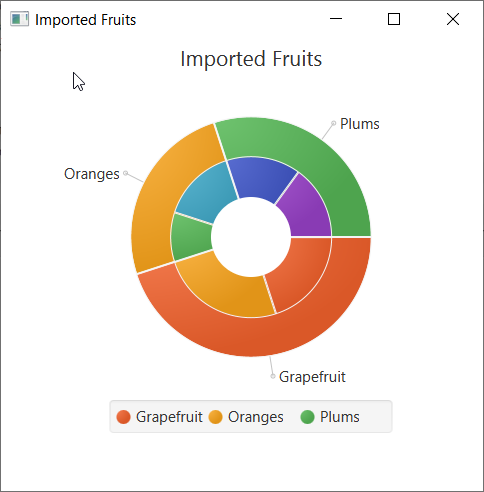
As the question looks intersting, I gave a try for your requirement. Indeed, I too encountered the exact issue of rendering the inner chart. Upon further investigation, looks like the issue lies in layout children of a Region.
As now we are introducing a stranger(aka inner chart), the outer chart's layoutChildren() does not know how to render it. You may ask that how come the circle is rendered. I think things will work differently with Shapes. Not sure ;-)
So to make it work, you need to provide the size of the inner chart in the layoutChartChildren() method of outer chart.
Skipping some stuff of what you provided, below is the quick demo of what I tried to get it work. I hope this can help you.
![enter image description here]()
import javafx.application.Application;
import javafx.collections.FXCollections;
import javafx.collections.ObservableList;
import javafx.geometry.BoundingBox;
import javafx.geometry.Bounds;
import javafx.geometry.Insets;
import javafx.scene.Group;
import javafx.scene.Node;
import javafx.scene.Scene;
import javafx.scene.chart.PieChart;
import javafx.scene.layout.Pane;
import javafx.scene.shape.Circle;
import javafx.stage.Stage;

import java.util.Set;
import java.util.stream.Collectors;

public class PieChartSample extends Application {

    @Override
    public void start(Stage stage) {
        Scene scene = new Scene(new Group());
        stage.setTitle("Imported Fruits");
        stage.setWidth(500);
        stage.setHeight(500);

        ObservableList<PieChart.Data> pieChartData =
                FXCollections.observableArrayList(
                        new PieChart.Data("Grapefruit", 45),
                        new PieChart.Data("Oranges", 25),
                        new PieChart.Data("Plums", 30));

        ObservableList<PieChart.Data> innerChartData =
                FXCollections.observableArrayList(
                        new PieChart.Data("G1", 20),
                        new PieChart.Data("G2", 25),
                        new PieChart.Data("O1", 10),
                        new PieChart.Data("O2", 15),
                        new PieChart.Data("P1", 15),
                        new PieChart.Data("P2", 15));
        final DonutChart chart = new DonutChart(pieChartData);
        chart.setTitle("Imported Fruits");
        chart.setInnerChartData(innerChartData);

        ((Group) scene.getRoot()).getChildren().add(chart);
        stage.setScene(scene);
        stage.show();
    }

    public static void main(String[] args) {
        launch(args);
    }

    class DonutChart extends PieChart {
        private final double SPACE = 30; /* Gap between outer and inner pie*/
        private PieChart innerChart;
        private Circle circle;
        private Bounds outerPieBounds;

        public DonutChart(ObservableList<PieChart.Data> data) {
            super(data);
            innerChart = new PieChart() {
                @Override
                protected void layoutChartChildren(double top, double left, double contentWidth, double contentHeight) {
                    super.layoutChartChildren(top, left, contentWidth, contentHeight);
                    final Pane chartContent = (Pane) lookup(".chart-content");
                    chartContent.setPadding(new Insets(0));
                }
            };
            innerChart.setPadding(new Insets(0));
            innerChart.setLabelsVisible(false);
            innerChart.setLegendVisible(false);

            circle = new Circle(40);
            circle.setOpacity(1);
            circle.setStyle("-fx-fill:white;");
        }

        @Override
        protected void layoutChartChildren(double top, double left, double contentWidth, double contentHeight) {
            super.layoutChartChildren(top, left, contentWidth, contentHeight);
            final Pane chartContent = (Pane) lookup(".chart-content");
            if (!chartContent.getChildren().contains(innerChart)) {
                chartContent.getChildren().add(innerChart);
            }
            if (!chartContent.getChildren().contains(circle)) {
                chartContent.getChildren().add(circle);
            }
            updateOuterPieBounds();
            double cX = outerPieBounds.getMinX() + (outerPieBounds.getWidth() / 2);
            double cY = outerPieBounds.getMinY() + (outerPieBounds.getHeight() / 2);
            circle.setCenterX(cX);
            circle.setCenterY(cY);
            double innerSize = outerPieBounds.getWidth() - (2 * SPACE);
            innerChart.resize(innerSize, innerSize); // THIS WHERE YOUR ISSUE LIES. YOU NEED TO PROVIDE THE SIZE TO INNER CHART
            innerChart.setTranslateX(cX - innerChart.getWidth() / 2);
            innerChart.setTranslateY(cY - innerChart.getHeight() / 2);
        }

        public void setInnerChartData(ObservableList<PieChart.Data> data) {
            innerChart.setData(data);
        }

        /**
         * Determining the outer pie visual bounds.
         */
        private void updateOuterPieBounds() {
            Pane chartContent = (Pane) lookup(".chart-content");
            Set<Node> pieNodes = chartContent.getChildren().stream().filter(node -> node.getStyleClass().contains("chart-pie")).collect(Collectors.toSet());
            double minX = getWidth();
            double minY = getHeight();
            double maxX = 0, maxY = 0;
            for (Node pie : pieNodes) {
                Bounds pieBounds = pie.getBoundsInParent();
                minX = Math.min(minX, pieBounds.getMinX());
                minY = Math.min(minY, pieBounds.getMinY());
                maxX = Math.max(maxX, pieBounds.getMaxX());
                maxY = Math.max(maxY, pieBounds.getMaxY());
            }
            outerPieBounds = new BoundingBox(minX, minY, maxX - minX, maxY - minY);
        }
    }
}


