How do I read an Istanbul Coverage Report?
Asked Answered
O

4

165

I've always used Jasmine for my unit tests, but recently I started using Istanbul to give me code coverage reports. I mean I get the gist of what they are trying to tell me, but I don't really know what each of these percentages represent (Stmts, Branches, Funcs, Lines). So far Googling I have been unable to find a solid explanation/resource.

Question: Like I said I get the gist of it, but can someone post either a proper explanation or a link to a proper explanation?

Tertiary Question: Is there any way to identify what specific parts of your code aren't covered? So far without really grokking this report I'm basically guessing.

-------------------|-----------|-----------|-----------|-----------|
File               |   % Stmts |% Branches |   % Funcs |   % Lines |
-------------------|-----------|-----------|-----------|-----------|
   controllers/    |      88.1 |     77.78 |     78.57 |      88.1 |
      dashboard.js |      88.1 |     77.78 |     78.57 |      88.1 |
-------------------|-----------|-----------|-----------|-----------|
All files          |      88.1 |     77.78 |     78.57 |      88.1 |
-------------------|-----------|-----------|-----------|-----------|
Outrelief answered 28/10, 2014 at 20:52 Comment(2)
Running istanbul should also produce an HTML file for the report (should be in the coverage folder). This HTML should give you drill-down information when you click on files/foldersAgma
Thanks @yarons. That definitely helps drill into the coverage and identify what specifically is not being covered. I still don't really understand in depth what the percentages mean =/.Outrelief
S
267

There are a number of coverage criteria, the main ones being:

  • Function coverage Has each function (or subroutine) in the program been called?
  • Statement coverage Has each statement in the program been executed?
  • Branch coverage Has each branch (also called DD-path) of each control structure (such as in if and case statements) been executed? For example, given an if statement, have both the true and false branches been executed? Another way of saying this is, has every edge in the program been executed?
  • Line coverage has each executable line in the source file been executed?

For each case, the percentage represents executed code vs not-executed code, which equals each fraction in percent format (e.g: 50% branches, 1/2).

In the file report:

  • 'E' stands for 'else path not taken', which means that for the marked if/else statement, the 'if' path has been tested but not the 'else'.
  • 'I' stands for 'if path not taken', which is the opposite case: the 'if' hasn't been tested.
  • The xN in left column is the amount of times that line has been executed.
  • Not executed lines, or pieces of code, will be highlighted in red.

This has been verified for Istanbul v0.4.0, I'm not sure if this still applies for subsequent versions, but being that library is based on solid theoretic principles, behavior shouldn't change too much for newer versions.

It also provides some color codes -

Pink: statements not covered.

Orange: functions not covered.

Yellow: branches not covered.

Full Istanbul docs here:

https://istanbul.js.org

For more in-depth theory on code coverage:

https://en.wikipedia.org/wiki/Code_coverage

Smaragd answered 18/4, 2016 at 14:58 Comment(3)
What I don't get is how it can give me 100% statement coverage, but less that 100% function converage on the same file. How can 100 percent of the statements have been covered if not even all functions were called?? E.g. I get this line in my coverage report: index.js | 100 | 100 | 87.5 | 100 | where the order of the columns is File | % Stmts | % Branch | % Funcs | % Lines | Uncovered Line #s. So 100% statement coverage, no uncovered lines. but only 87.5% function coverage. How??Succinic
I get these results from NYC btw, but the priciple is the same right?Succinic
This needs to be added to the doc page of istanbuil.js.org : /Dunn
A
8

Running istanbul should also produce an HTML file for the report (should be in the coverage folder). This HTML should give you drill-down information when you click on files/folders.

The percentage of functions covered is calculated by the number of functions that were called during tests, divided by total number of functions. Same goes for lines and statements (which will usually be close to each other unless you have very long statements). Branches mean decision points like if-else blocks. For example, say your code only contains one if-else statement, and your tests only pass through the if part but not the else part, then your branches percentage should be 50%.

Hope that makes things clearer.

Agma answered 29/10, 2014 at 16:2 Comment(3)
I ran istanbul by specifying "test" : "nyc mocha" in package.json. My coverage folder is blank. Thoughts?Honkytonk
I added html reporter. It works now. "test" : "nyc --reporter=html mocha"Honkytonk
As an example: if you have a large if-branch and a tiny else-branch, and only the if-branch was run, the line coverage will look great but the branch coverage will still be only 50%. Also, you can have multiple statements per line if the statements are separated by semicolons or if the line includes a function definition (which contains its own statements). You can have multiple lines per statement if the statement has line breaks before the final semicolon.Suckow
K
8

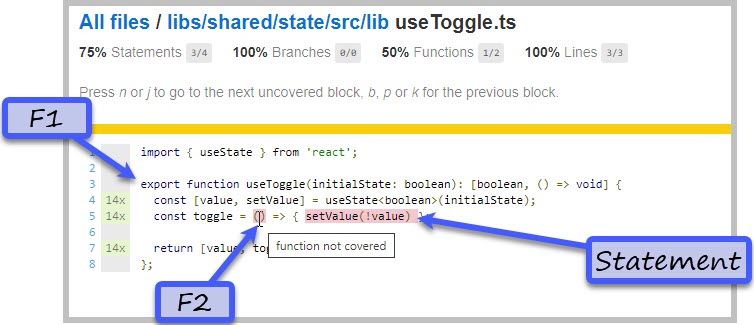
@StijndeWitt: You asked

What I don't get is how it can give me 100% statement coverage, but less that 100% function converage on the same file. How can 100 percent of the statements have been covered if not even all functions were called?

The attached screenshot illustrates how Line Coverage can be 100%, but Function Coverage is less. Lines 4, 5, and 7 count as lines. The line containing the function definition (F1) at line 3 does not, but it obviously contains a function. Line 5 also contains a function (F2) and an additional statement. Therefor, in NYC's world of counting:

  • lines = 3
  • statements = 4 (of which 1 is not covered)
  • functions = 2 (of which 1 is not covered)

Apparently, function headers do not count as 'lines' but they do count as a function. That explains why Line Coverage can be 100%, while Function Coverage (or Statement Coverage) is less. Function coverage is less than 00%

Kent answered 26/10, 2021 at 12:5 Comment(0)
C
0

Adding to the previous answers

The %Statements is calculated by taking a percentage of the number of statements covered by your test e.g 12/18 * 100 = 66.67%. This means that your test covered only 66.67%.

The %Branch is also calculated in the same way. Same for your %Functions and %lines.

In your project root directory, there is a coverage folder that contains HTML output of your test. Click on it and view it in the browser. You should see something like this

Image showing the output of your test results

I hope this helps you understand it better.

Crisis answered 12/11, 2018 at 13:40 Comment(0)

© 2022 - 2024 — McMap. All rights reserved.