ggplot2 horizontal barplot with gradient color fill
Asked Answered
S

2

7

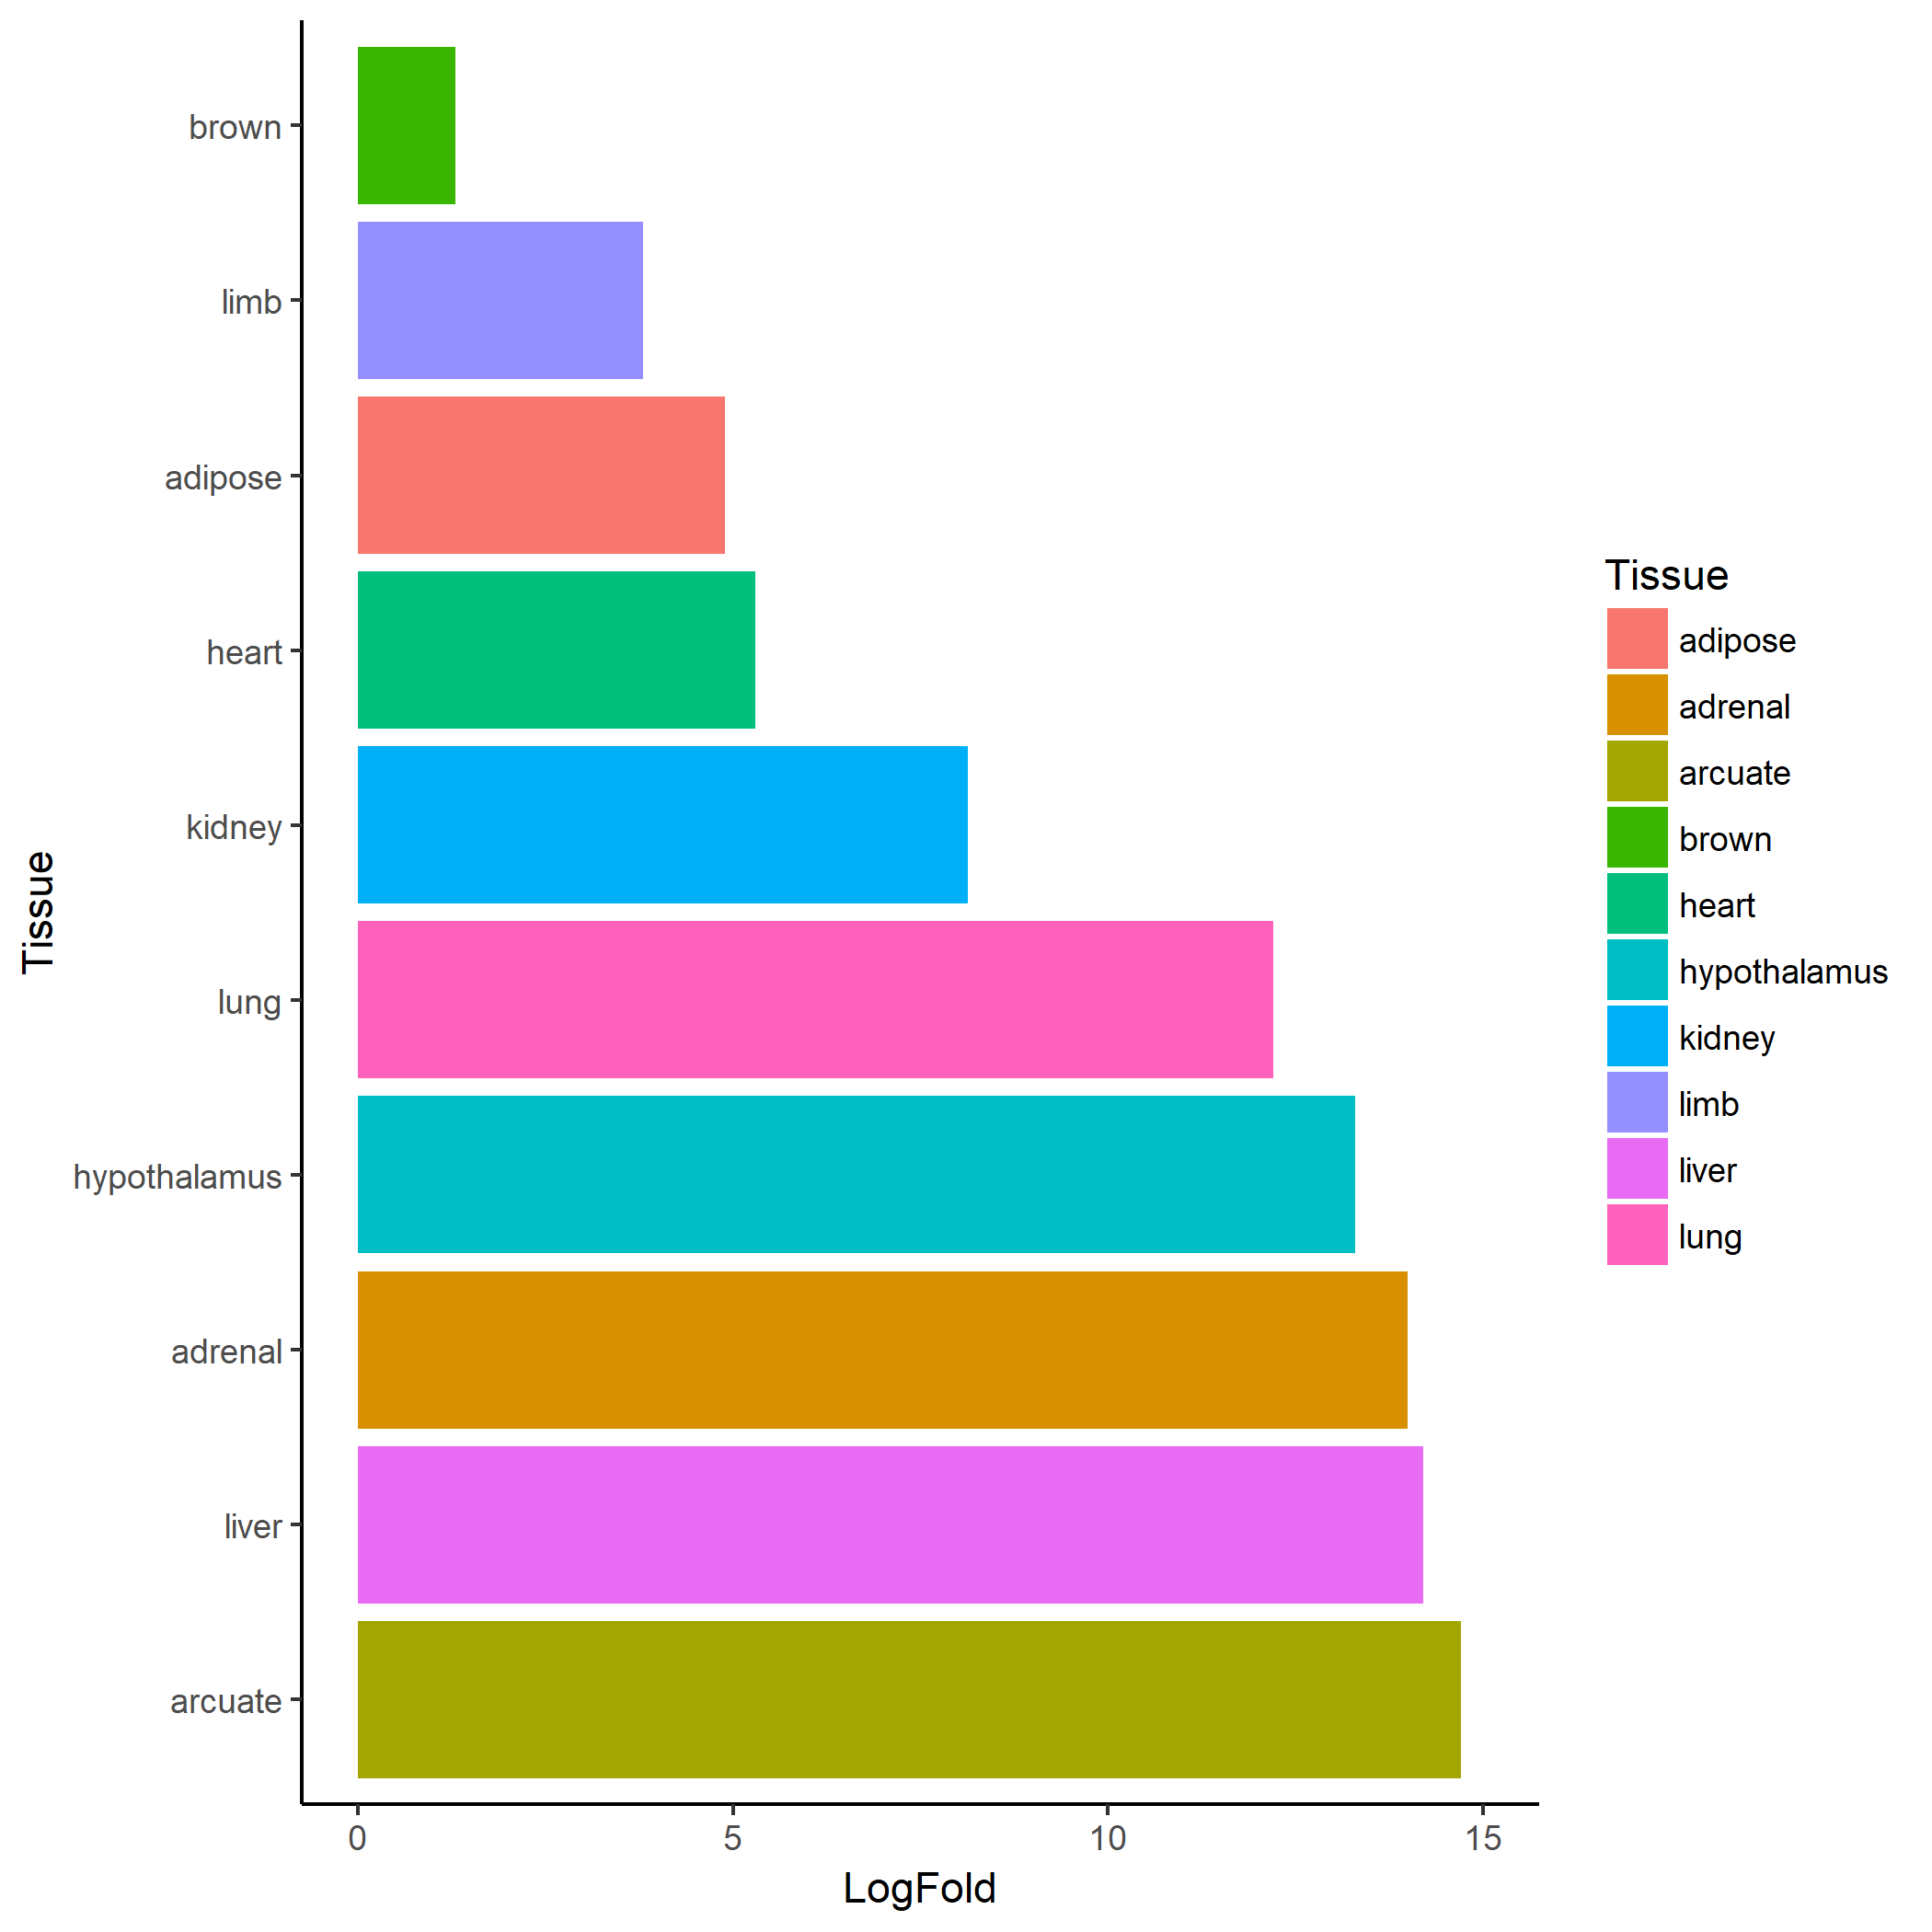
I am trying to create horizontal bar plot and would like to fill the individual bar as per their log fold values, white for lowest value and darkest for highest value. However, I am not able to do it. Here is my work, can somebody help me fix it?

df <- data.frame(LogFold = c(14.20, 14.00, 8.13, 5.3, 3.8, 4.9, 1.3, 13.3, 14.7, 12.2),
              Tissue = c("liver", "adrenal", "kidney", "heart", "limb", "adipose", "brown", "hypothalamus", "arcuate", "lung"))
df1<-df%>%
arrange(desc(LogFold))

ggplot(data=df1, aes(x=Tissue, y=LogFold, fill = Tissue)) +
geom_bar(stat="identity")+
scale_colour_gradient2()+
coord_flip()+
ylim(0, 15)+
scale_x_discrete(limits = df1$Tissue)+
theme_classic()

enter image description here

Thank You in advance!

Sloth answered 21/3, 2018 at 1:59 Comment(0)
M
9

Here's what you need to think about:

  • sorting the data frame values makes no difference to ggplot
  • in your code you are mapping fill color to Tissue, not to LogFold
  • the newer geom_col is less typing than geom_bar(stat = ...)
  • the limits to your scale are unnecessary as you specify all values for Tissue
  • if you want to fill with a gradient use scale_fill_gradient2()
  • fill = white will not be visible on the white background of theme_classic

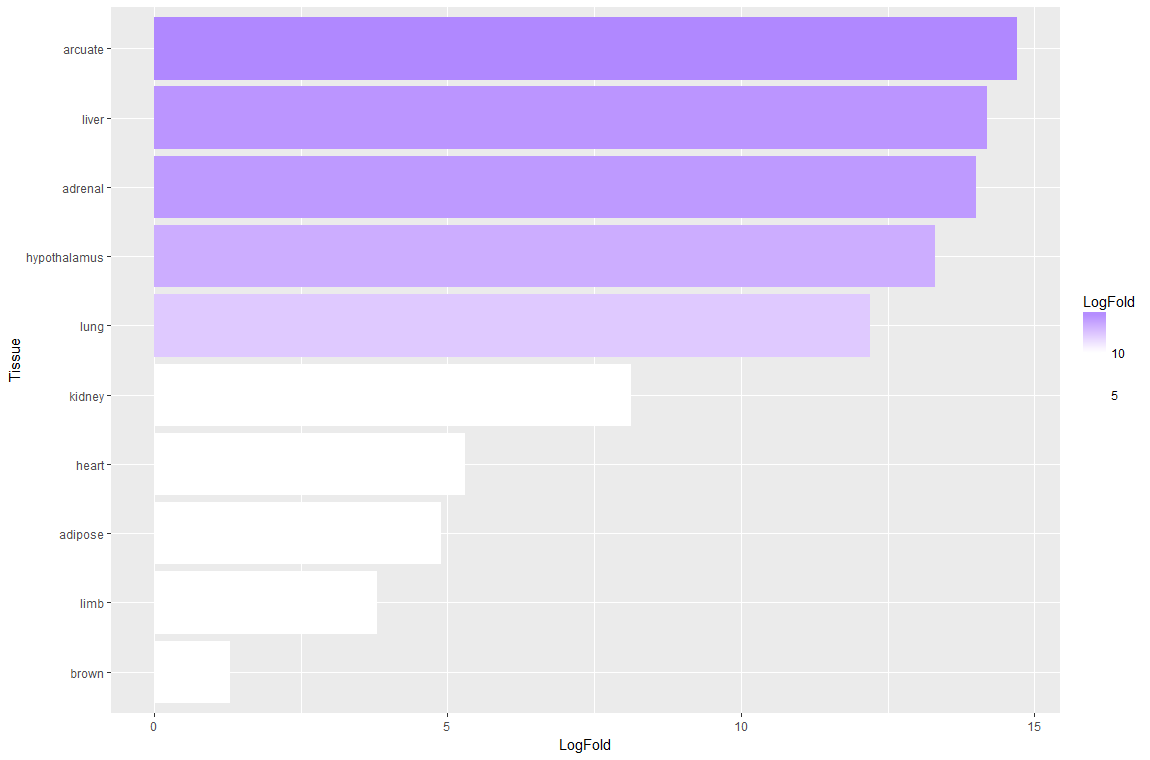
So you could try something like this:

library(tidyverse)
df1 %>% 
  ggplot(aes(reorder(Tissue, LogFold), LogFold)) + 
  geom_col(aes(fill = LogFold)) + 
  scale_fill_gradient2(low = "white", 
                       high = "blue", 
                       midpoint = median(df1$LogFold)) + 
  coord_flip() + 
  labs(x = "Tissue")

enter image description here

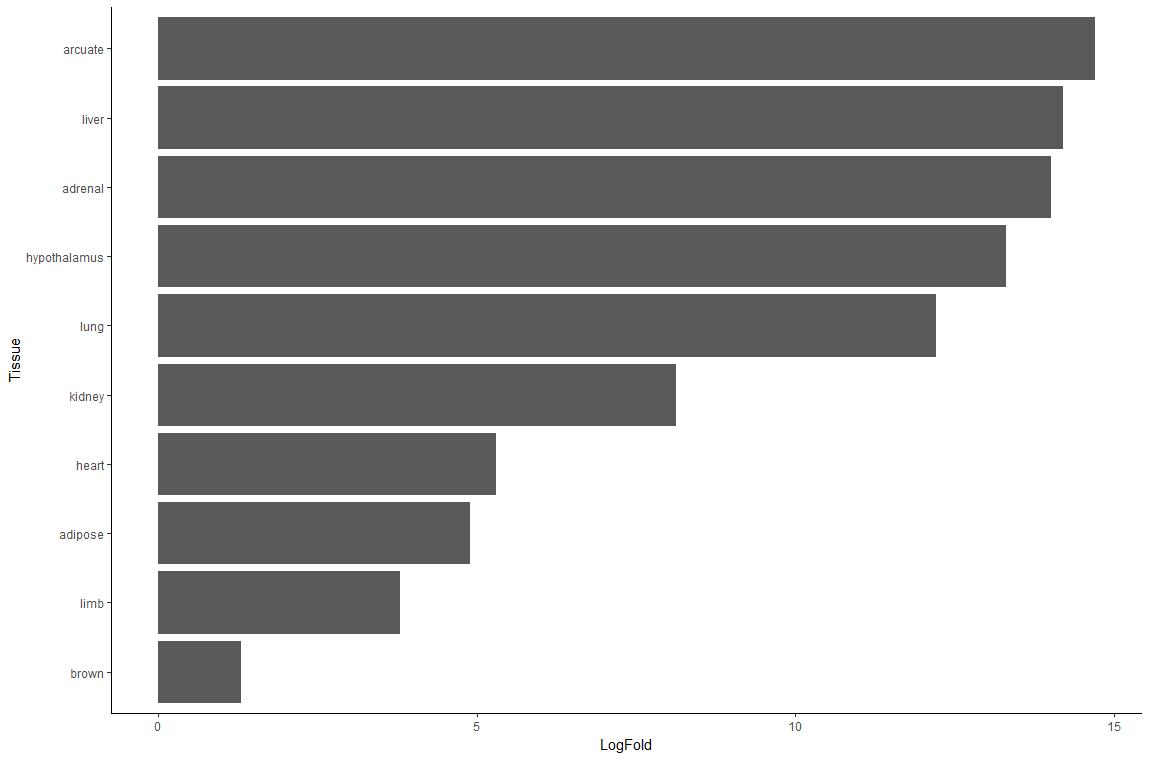
But I don't know that the color gradient really adds anything much in terms of interpreting the information. So here's the result without it, you be the judge:

df1 %>% 
  ggplot(aes(reorder(Tissue, LogFold), LogFold)) + 
    geom_col() + 
    coord_flip() + 
    labs(x = "Tissue") + 
    theme_classic()

enter image description here

Mra answered 21/3, 2018 at 2:24 Comment(0)
F
0

hope this works.

ggplot(data=df1, aes(x=Tissue, y=LogFold, fill = LogFold)) +
        geom_bar(stat="identity",color="black")+
        scale_fill_gradient(low="white",high="darkred")+
        coord_flip()+
        ylim(0, 15)+
        scale_x_discrete(limits = df1$Tissue)+
        theme_classic()
Finzer answered 21/3, 2018 at 2:17 Comment(0)

© 2022 - 2024 — McMap. All rights reserved.