How to force scientific notation with renderDT
Asked Answered
S

2

7

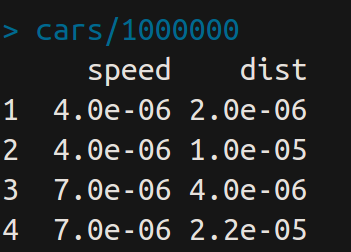
I would like the behaviour of numeric values in DT tables to be the same than in the print output when using :

options(scipen = -1)
options(digits = 3)
cars/1000000

enter image description here

But whatever are the options, it seems that DT do not care about it: enter image description here
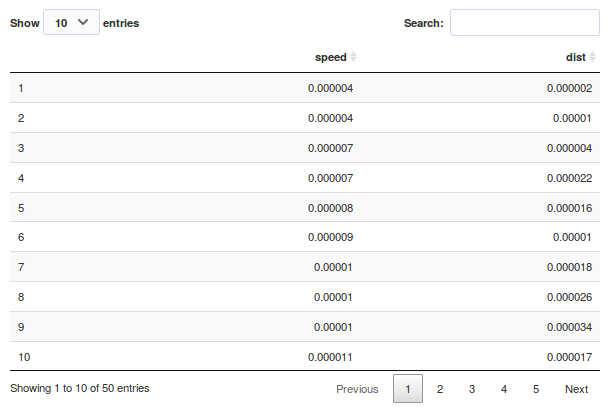
I know that print is not the same as rendering a table, but there should be a way to do it. I can play with signif or round to limit digits but I am losing information with very low values and this affects high values differently.

  • I want to keep values as numeric so that the column can be sorted correctly.
  • Values should be kept classical if only 3 digits, and scientific if more.

Here is the minimal example.

library(shiny)
library(DT)
library(dplyr)

options(scipen = -1)
options(digits = 3)

# Define UI for application that draws a histogram
ui <- fluidPage(
   # Application title
   titlePanel("Old Faithful Geyser Data"),
   # Sidebar with a slider input for number of bins 
   sidebarLayout(
      sidebarPanel(
      ),
      # Show a plot of the generated distribution
      mainPanel(
         DTOutput("dt"),
         DTOutput("dt2")
      )
   )
)

# Define server logic required to draw a histogram
server <- function(input, output) {
   output$dt <- renderDT({cars/1000000})
   output$dt2 <- renderDT({
     mutate_all(cars/1000000, funs(signif(., digits = 1)))
     })
}
# Run the application 
shinyApp(ui = ui, server = server)

Any clues ?

Sicklebill answered 3/4, 2018 at 15:54 Comment(0)
S
3

You could try using a rowCallback to change the notation to scientific using the toExponential javascript function.

Here's an example:

library(shiny)
library(DT)
library(dplyr)

# Define UI for application that draws a histogram
ui <- fluidPage(
  # Application title
  titlePanel("Old Faithful Geyser Data"),
  # Sidebar with a slider input for number of bins 
  sidebarLayout(
    sidebarPanel(
    ),
    # Show a plot of the generated distribution
    mainPanel(
      DTOutput("dt")
    )
  )
)

# Define server logic required to draw a histogram
server <- function(input, output) {
  output$dt <- renderDT({
    datatable(cars/10,options = list(
      rowCallback = JS(
        "function(row, data) {",
        "for (i = 1; i < data.length; i++) {",
        "if (data[i]>1000 | data[i]<1){",
        "$('td:eq('+i+')', row).html(data[i].toExponential(1));",
        "}",
        "}",
        "}")
    )
    )
  })
}
# Run the application 
shinyApp(ui = ui, server = server)
Seldan answered 3/4, 2018 at 16:49 Comment(5)
Thanks. I assume that I can write my own JS (with some if-statement ?) if I only want values upper than 1000 for instance to be transformed as exponential.Export
Yes, I added an if in the example to have a scientific notation for numbers larger than 1000 and smaller than 1 for example.Seldan
This is perfect. Thanks.Export
two minor follow up questions NicE, I like your answer and will use it. Is it also possibly to format scientific to 1.54 E02 instead of 1.5e2 (2 decimals and double digit exponential, and secondly, format the numbers <1000 to 2 decimals ?Handclasp
@NicE, how to remove the if statement? Sorry I have no knowledge in JS. Thanks.Blackcock
B
6

The DT package also has a formatSignif() function that can help with this, e.g.:

output$tbl <- renderDataTable({
    DT::datatable(dat) %>%
        formatSignif(columns = c('speed', 'dist'), digits = 3)
})
Bifid answered 10/9, 2020 at 18:34 Comment(1)
Do you know if there is some restriction about smaller than 0 scientific notation as this doesn't seem to work for these. Any thoughts?Nightwear
S
3

You could try using a rowCallback to change the notation to scientific using the toExponential javascript function.

Here's an example:

library(shiny)
library(DT)
library(dplyr)

# Define UI for application that draws a histogram
ui <- fluidPage(
  # Application title
  titlePanel("Old Faithful Geyser Data"),
  # Sidebar with a slider input for number of bins 
  sidebarLayout(
    sidebarPanel(
    ),
    # Show a plot of the generated distribution
    mainPanel(
      DTOutput("dt")
    )
  )
)

# Define server logic required to draw a histogram
server <- function(input, output) {
  output$dt <- renderDT({
    datatable(cars/10,options = list(
      rowCallback = JS(
        "function(row, data) {",
        "for (i = 1; i < data.length; i++) {",
        "if (data[i]>1000 | data[i]<1){",
        "$('td:eq('+i+')', row).html(data[i].toExponential(1));",
        "}",
        "}",
        "}")
    )
    )
  })
}
# Run the application 
shinyApp(ui = ui, server = server)
Seldan answered 3/4, 2018 at 16:49 Comment(5)
Thanks. I assume that I can write my own JS (with some if-statement ?) if I only want values upper than 1000 for instance to be transformed as exponential.Export
Yes, I added an if in the example to have a scientific notation for numbers larger than 1000 and smaller than 1 for example.Seldan
This is perfect. Thanks.Export
two minor follow up questions NicE, I like your answer and will use it. Is it also possibly to format scientific to 1.54 E02 instead of 1.5e2 (2 decimals and double digit exponential, and secondly, format the numbers <1000 to 2 decimals ?Handclasp
@NicE, how to remove the if statement? Sorry I have no knowledge in JS. Thanks.Blackcock

© 2022 - 2024 — McMap. All rights reserved.