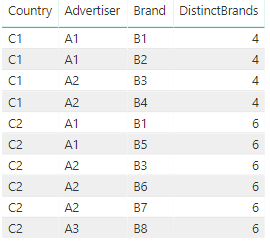
I have a table like below:
Country, Advertiser, Brand, Spend
C1,      A1,         B1,    10
C1,      A1,         B2,    5
C1,      A2,         B3,    0
C1,      A2,         B4,    20
C2,      A1,         B1,    8
C2,      A1,         B5,    7
C2,      A2,         B6,    4
C2,      A2,         B3,    3
C2,      A2,         B7,    2
C2,      A3,         B8,    9
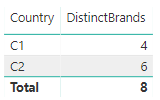
I'd like to get the DISTINCT COUNT of Brands by Country, which is simply:
C1 => 4
C2 => 6
How do I create a measure in Power BI that I can embed in a table or a tree-map? I have already tried this:
Measure = COUNTX(DISTINCT(sourceTable),sourceTable[Brand])
which returns total Brand count (not DISTINCT COUNT) per Country...
I have also tried below and it didn't work:
DistinctBrandCount =
    CALCULATE(DISTINCTCOUNT(SampleDataForDashboard[Brand]),
        GROUPBY(SampleDataForDashboard, SampleDataForDashboard[Country]))


