Memory usage keeps rising on older devices using Metal
Asked Answered
D

2

7

I use Metal and CADisplayLink to live filter a CIImage and render it into a MTKView.

// Starting display link 
displayLink = CADisplayLink(target: self, selector: #selector(applyAnimatedFilter))
displayLink.preferredFramesPerSecond = 30
displayLink.add(to: .current, forMode: .default)

@objc func applyAnimatedFilter() {
    ...
    metalView.image = filter.applyFilter(image: ciImage)
}

According to the memory monitor in Xcode, memory usage is stable on iPhone X and never goes above 100mb, on devices like iPhone 6 or iPhone 6s the memory usage keeps growing until eventually the system kills the app.

I've checked for memory leaks using Instruments, but no leaks were reported. Running the app through Allocations also don't show any problems and the app won't get shut down by the system. I also find it interesting that on newer devices the memory usage is stable but on older it just keeps growing and growing.

The filter's complexity don't matter as I tried even most simple filters and the issue persists. Here is an example from my metal file:

extern "C" { namespace coreimage {

    float4 applyColorFilter(sample_t s, float red, float green, float blue) {

        float4 newPixel = s.rgba;
        newPixel[0] = newPixel[0] + red;
        newPixel[1] = newPixel[1] + green;
        newPixel[2] = newPixel[2] + blue;

        return newPixel;
    }
}

I wonder what can cause the issue on older devices and in which direction I should look up to.

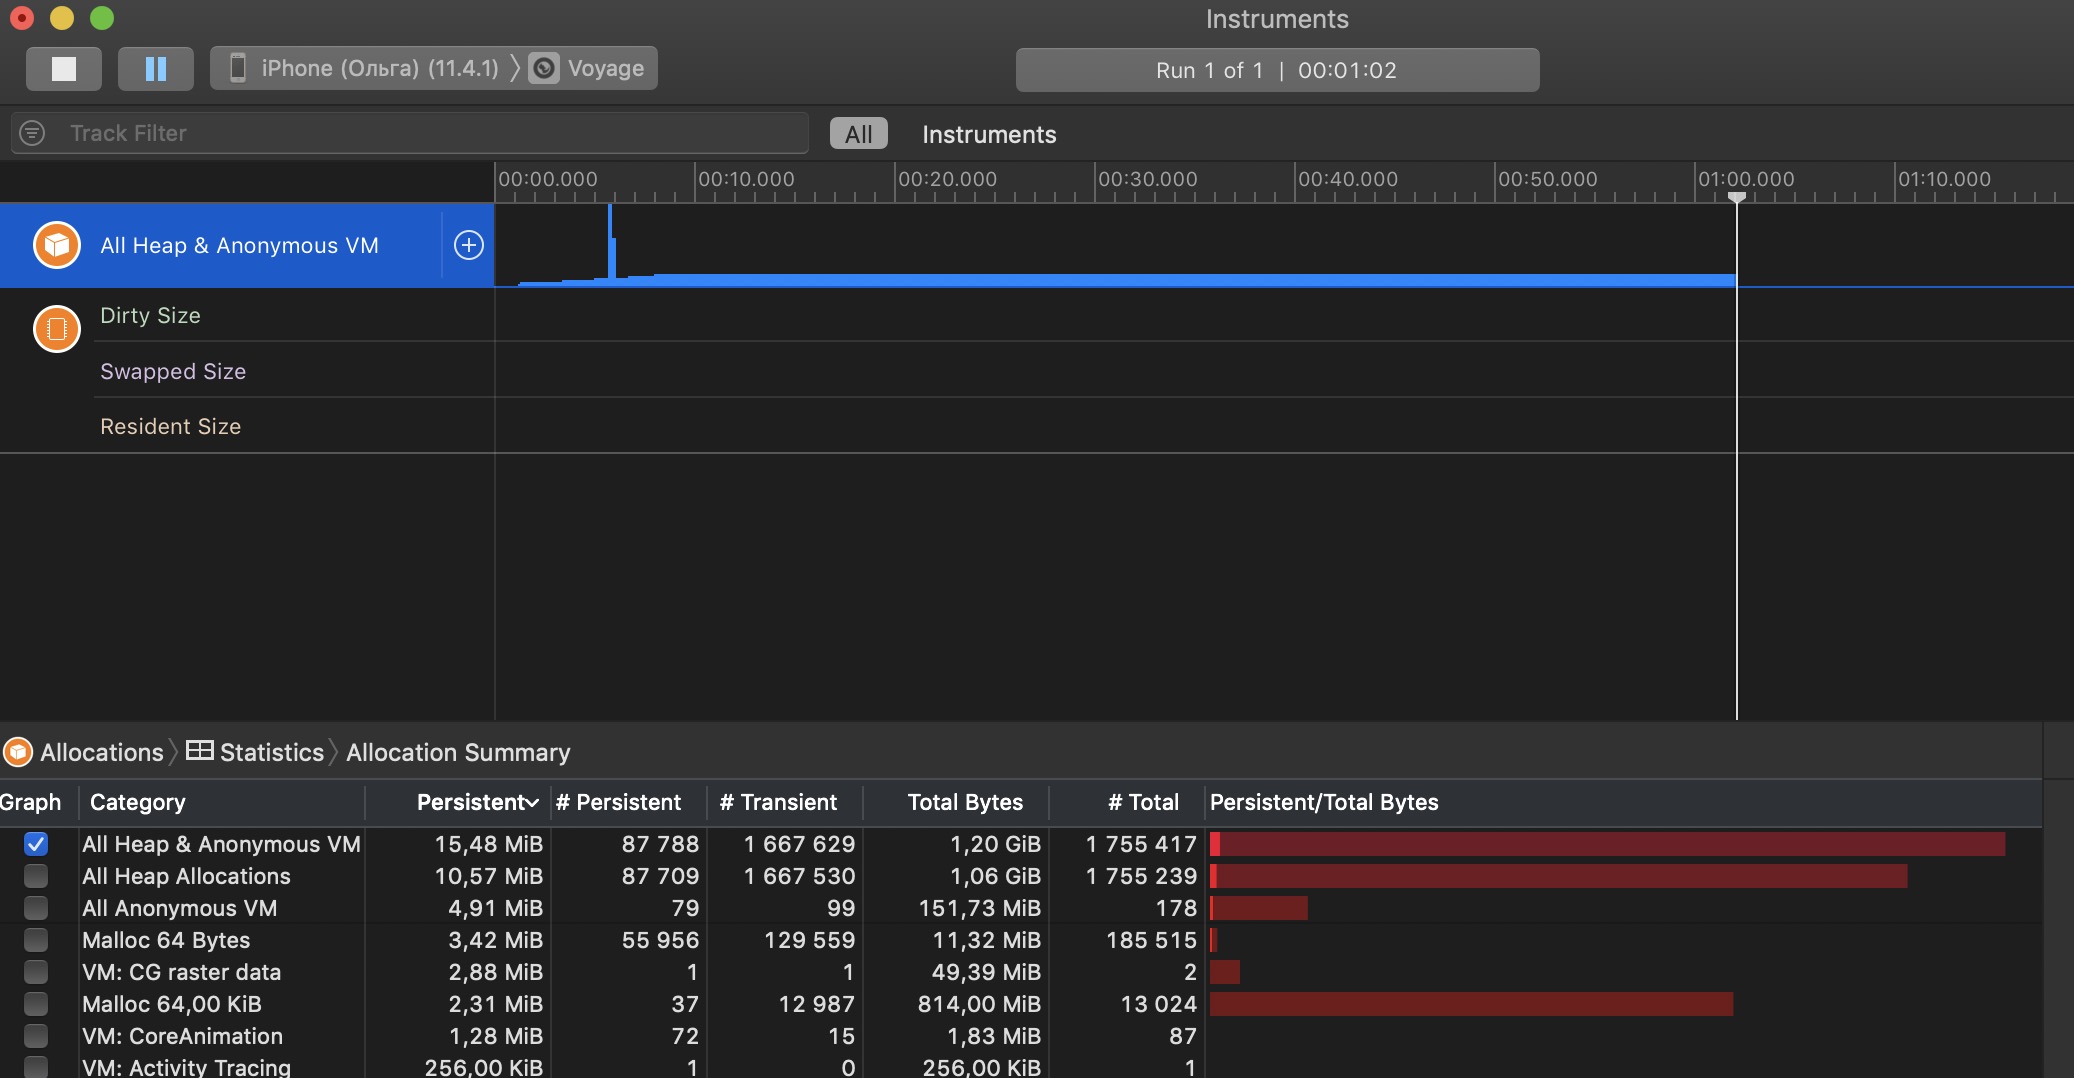
Update 1: here are two 1 minute graphs, one from Xcode and one from Allocations both using the same filter. Allocations graph is stable while Xcode graph is always growing:

Xcode

Allocations

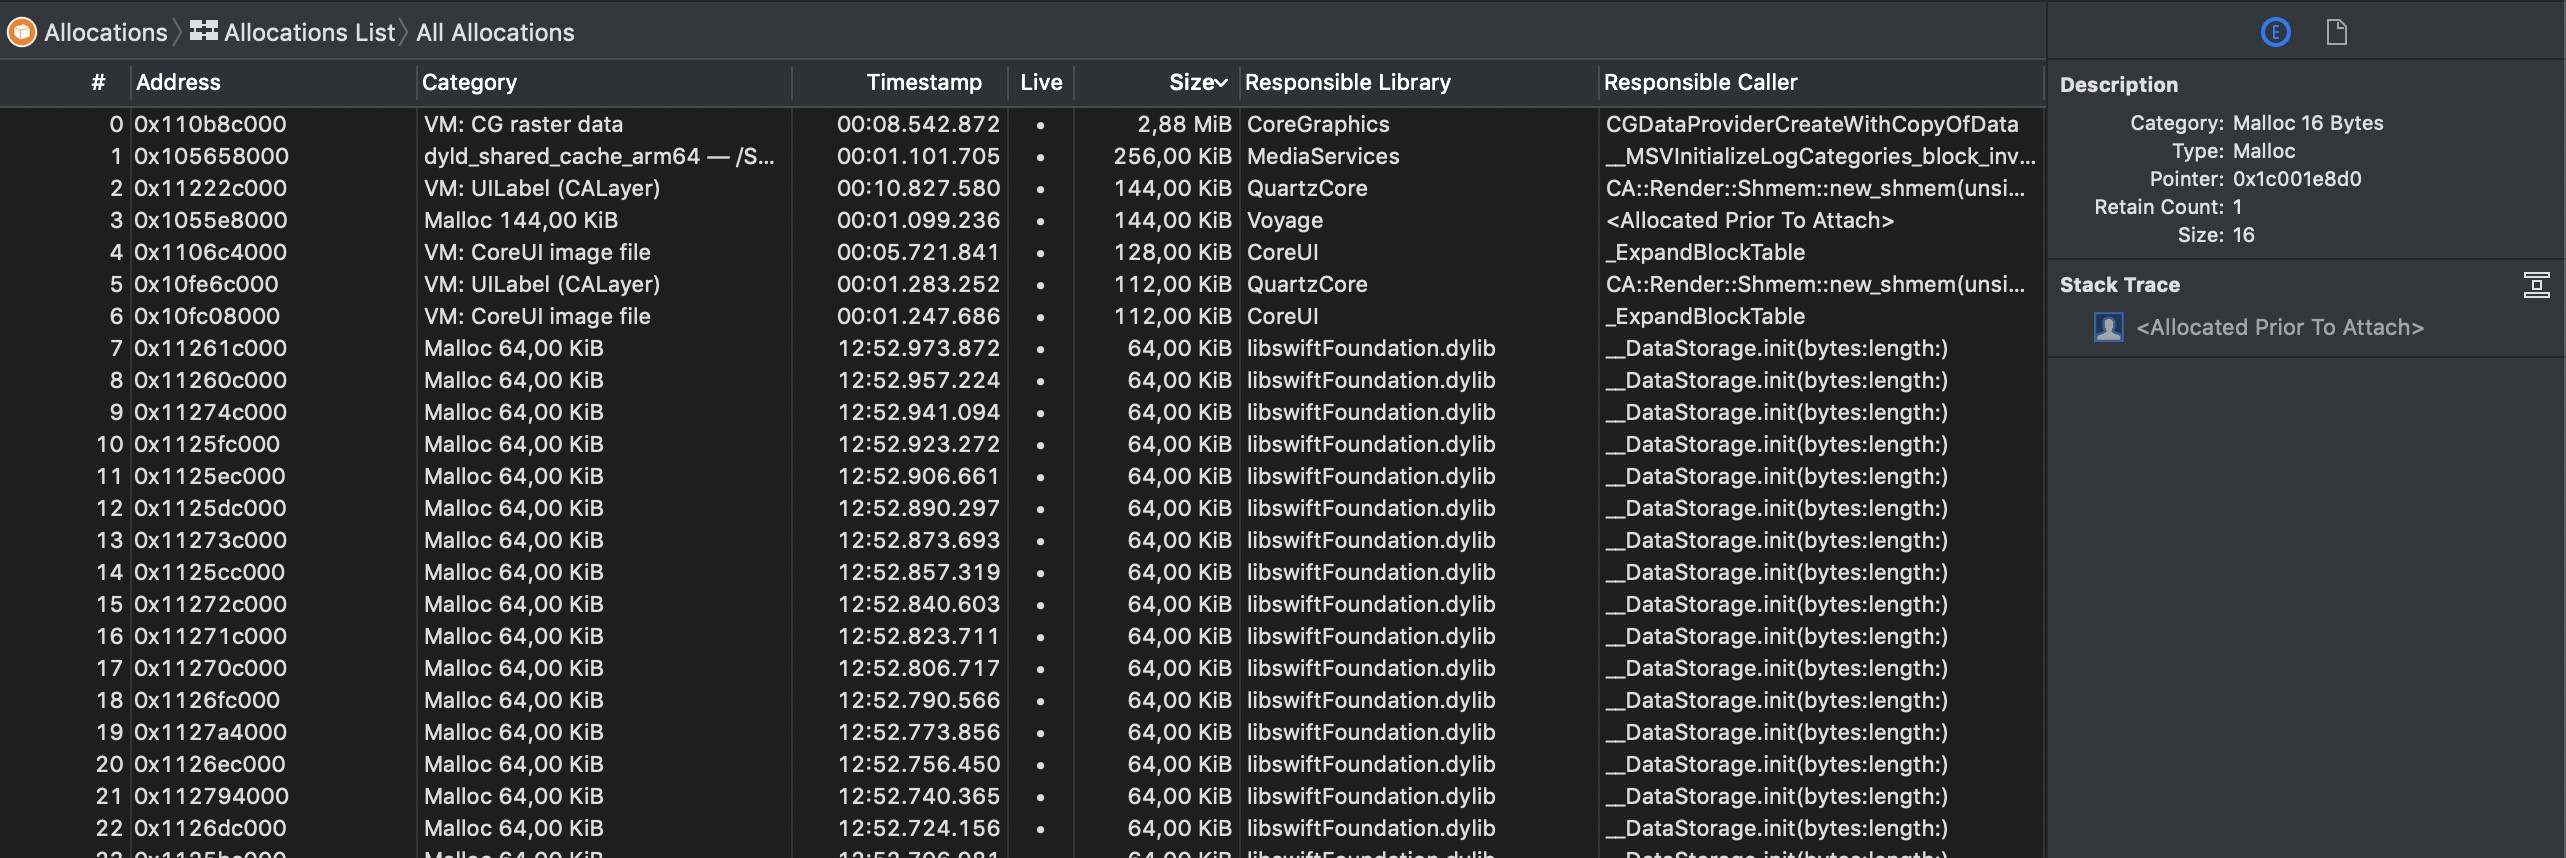
Update 2: Attaching a screenshot of Allocations List sorted by size, the app was running for 16 minutes, applying the filter non stop:

enter image description here

Update 3: A bit more info on what is happening in applyAnimatedFilter():

I render a filtered image into a metalView which is a MTKView. I receive the filtered image from filter.applyFilter(image: ciImage), where in Filter class happens next:

 func applyFilter(image: ciImage) -> CIImage {
    ...
    var colorMix = ColorMix()
    return colorMix.use(image: ciImage, time: filterTime)
 }

where filterTime is just a Double variable. And finally, here is the whole ColorMix class:

import UIKit

class ColorMix: CIFilter {

    private let kernel: CIKernel

    @objc dynamic var inputImage: CIImage?
    @objc dynamic var inputTime: CGFloat = 0

    override init() {

        let url = Bundle.main.url(forResource: "default", withExtension: "metallib")!
        let data = try! Data(contentsOf: url)
        kernel = try! CIKernel(functionName: "colorMix", fromMetalLibraryData: data)
        super.init()
    }

    required init?(coder aDecoder: NSCoder) {
        fatalError("init(coder:) has not been implemented")
    }

    func outputImage() -> CIImage? {

        guard let inputImage = inputImage else {return nil}

        return kernel.apply(extent: inputImage.extent, roiCallback: {
            (index, rect) in
            return rect.insetBy(dx: -1, dy: -1)
        }, arguments: [inputImage, CIVector(x: inputImage.extent.width, y: inputImage.extent.height), inputTime])
    }

    func use(image: CIImage, time: Double) -> CIImage {

        var resultImage = image

        // 1. Apply filter
        let filter = ColorMix()
        filter.setValue(resultImage, forKey: "inputImage")
        filter.setValue(NSNumber(floatLiteral: time), forKey: "inputTime")

        resultImage = filter.outputImage()!

        return resultImage
    }

}
Donegan answered 2/7, 2019 at 14:41 Comment(23)
Did you try adding an autorelease pool?Deel
@Deel I didn't, I thought it doesn't do much in a Swift only project?Donegan
Well, you thought wrong about that. :) I'm not promising it will solve this particular problem, but at least let's try it. Wrap the whole interior of applyAnimatedFilter in an autoreleasepool block and let's see if makes any difference.Deel
@Deel thanks, I will try it right now :) Also I've noticed that when running the app on Allocations through Instruments, it won't get killed and the memory graph is stable. Could there be any differences in memory management between Xcode and Instruments?Donegan
@Deel Adding autireleasepool didn't make a difference according to Xcode memory graphDonegan
OK but hold it. It sounds to me like you might be making the mistake I describe here: https://mcmap.net/q/1620927/-does-xcode-39-s-debug-navigator-work-different-from-instruments-allocations If you want to know what your real memory usage is, do a Release build. Instruments does that automatically but if you just build-and-run onto a device you're getting a Debug build, which is different and cannot give you a true picture of memory usage.Deel
I'm going to guess that this effect is illusory, caused by the fact that you are testing by doing a build-and-run onto your device from Xcode. That's a Debug build. Memory management in a Debug build is not a measure of how your memory will behave in the real app. Instead, create a Scheme whose Run action specifies a Release build and build-and-run from that Scheme. If the memory growth goes away, the problem is solved. (Again, I promise nothing, but hey, it's worth a try.)Deel
@Deel sorry, I got a bit confused :D I just created a new scheme with Release build configuration and did a "build and run" on device - the Xcode memory graph still showed a constantly growing memory usage. But when I run it in Instruments, the memory usage seem to be OK. Whom do I trust? :DDonegan
Well, not me, clearly. :( Hmm, you say "the memory usage seem to be OK". But Instruments doesn't show virtual memory, such as images. If you were constantly loading images, I would expect memory to grow but I would not expect Instruments to show that. Is that the case?Deel
I don't constantly load any images, just processing one single input CIImage with Metal filter (which also doesn't involve any images loading, just modifies the input image) and rendering it back to MTKView.Donegan
It is likely that the issue is cause by CoreImage allocating and then not effectively releasing backing bitmap buffers when you call applyFilter. I ran into an issue like this with CoreImage invoked from SpriteKit and there appears to be no solution. #54432326Churchwarden
@Churchwarden It's good that you came along! So did you file an Apple bug report on this?Deel
@Deel I included screenshots of both graphs in the updateDonegan
@Churchwarden that's a bummer, I wonder why it happens only on older devices though?Donegan
Yes, I filed an bug with Apple. No response after like 6 months. Basically, I decided not to use CoreImage. I am just directly interfacing with the GPU using Metal as this approach does not have memory leaks and you can manage large buffers properly.Churchwarden
@Donegan Can you post a screenshot of the Allocations List in Instruments, probably sorted by size? Would be interesting to see what those allocations are.Gyrate
Also maybe a bit more detail on what happens inside applyAnimatedFilter.Gyrate
hey @FrankSchlegel, I updated my answer :)Donegan
Try turning off Metal validation, GPU capture, and maybe other diagnostic options in the scheme. I believe I've seen reports of those causing memory growth like you're describing.Bilyeu
What is your image size?Neddra
@0xBFE1A8 input UIImage size is: (375.0, 500.0) before I convert it to CIImageDonegan
@Donegan Could you please also show how you render the CIImage into the MTKView (what happens when you assign metalView.image)?Gyrate
@KenThomases cheers, that totally worked! After I disabled those diagnostics in the scheme, the memory graph became stable and the app worked without any problems. Could you make an answer out of that so I accept it?Donegan
B
7

This is a bug in Xcode's diagnostic features (Metal validation and/or GPU frame capture). If you turn those off, the memory usage should be similar to when running outside of Xcode.

Bilyeu answered 3/7, 2019 at 14:40 Comment(2)
This did the trick for me too! I have a video game engine where I've allocated all of the game's memory up front, and it was surprising to me that the memory could possibly keep increasing like that. Thanks!Router
SDL was causing a memory leak and low-and-behold it wasn't really SDL, but instead the fact that I had Metal API validation turned on in the Scheme editor. Thanks so much!Tenterhook
G
2

Here are a few observations, but I'm not sure if one of them actually causes the memory usage you're seeing:

  • In applyFilter you are creating a new ColorMix filter every frame. Additionally, inside the instance method use(image:, time:) you are creating another one on every call. That's a lot of overhead, especially since the filter loads it's kernel every time on init. It would be advisable to just create a single ColorMix filter during setup and just update its inputImage and inputTime on every frame.
  • outputImage is not a func, but a var that you override from the CIFilter super class:

    override var outputImage: CIImage? { /* your code here */ }

  • Is your colorMix kernel performing any kind of convolution? If not, it could be a CIColorKernel instead.

  • If you need the size of the input inside your kernel, you don't need to pass it as extra argument. You can just call .size() on the input sampler.
Gyrate answered 3/7, 2019 at 6:31 Comment(2)
Hey Frank, thanks for your great optimisation tips! I will adapt them in my code. Creating a new filter every frame was really irrational. Ken Thomases suggestion about turning off Metal validation and GPU capture in the scheme did the trick for me and now the memory graph is stable in Xcode.Donegan
Nice! Glad I could help. 🙂Gyrate

© 2022 - 2024 — McMap. All rights reserved.