How to connect the median values of a boxplot with multiple groups using lines in ggplot2?
Asked Answered
S

1

7

I am trying to connecting the median values of a boxplot using ggplot2, but the lines are not in the correct positions.

Here is the code I used.

library(datasets)
library(ggplot2)

data(airquality)
airquality$Month <- factor(airquality$Month,
                           labels = c("May", "Jun", "Jul", "Aug", "Sep"))
airquality$Day <- ifelse(airquality$Day >= 15, 'End', 'Begining')

ggplot(airquality, aes(x = Month, y = Ozone, fill = Day)) +
    geom_boxplot() +
stat_summary(fun.y = median, geom = 'line', aes(group = Day, colour =Day))

The lines are just showing in the plot but not connecting the median values which is what I want. enter image description here
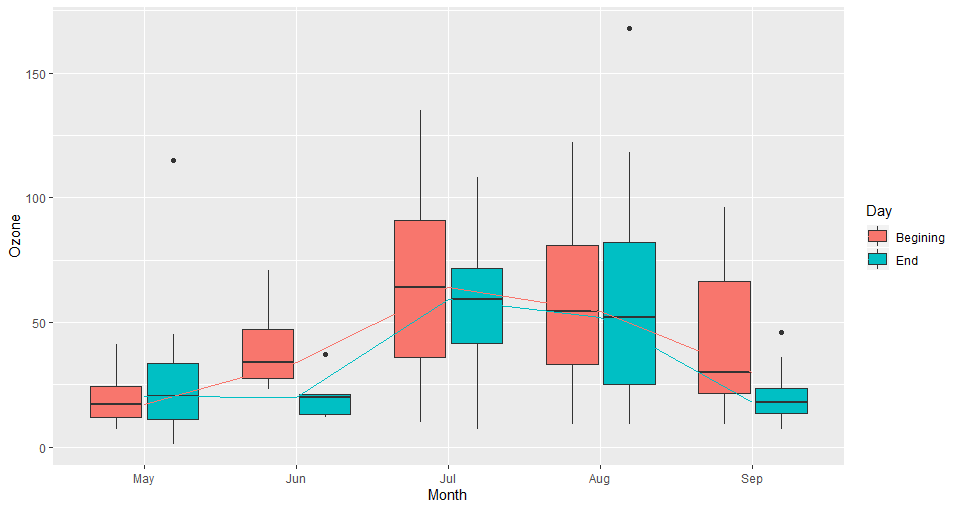
Any help will be appreciated.

Spears answered 15/7, 2019 at 16:0 Comment(0)
R
9

For this, you should specify the position parameters explicitly. geom_boxplot defaults to position_dodge, but you have to specify it for the line.

ggplot(airquality, aes(x = Month, y = Ozone, fill = Day)) +
  geom_boxplot(position = position_dodge(width = 0.9)) +
  stat_summary(
    fun.y = median,
    geom = 'line',
    aes(group = Day, colour = Day),
    position = position_dodge(width = 0.9) #this has to be added
  )
Rich answered 15/7, 2019 at 17:40 Comment(0)

© 2022 - 2024 — McMap. All rights reserved.