Clustering similar time series?
Asked Answered
T

1

7

I have somewhere between 10-20k different time-series (24 dimensional data -- a column for each hour of the day) and I'm interested in clustering time series that exhibit roughly the same patterns of activity.

I had originally started to implement Dynamic Time Warping (DTW) because:

  1. Not all of my time series are perfectly aligned
  2. Two slightly shifted time series for my purposes should be considered similar
  3. Two time series with the same shape but different scales should be considered similar

The only problem I had run into with DTW was that it did not appear to scale well -- fastdtw on a 500x500 distance matrix took ~30 minutes.

What other methods exist that would help me satisfy conditions 2 & 3?

Thing answered 12/10, 2019 at 20:16 Comment(4)
stats.stackexchange.com might be more appropriate... I'd expect you're going to have to be much more specific, doing that naively is not going to scale 20k**2 * (num shifts + num scales)**2. this sounds a bit like "sequence alignment" in genomics, their data is pretty different but it might help you get some ideasOldline
What kind of clustering algorithm are you using?Miseno
Take a look at k-Shape clustering, with Python implementations here and here. If you can/want to check other languages, the R implementation in dtwclust is multi-threaded.Briticism
maybe the problem here is the scale of the timeseries,so i would suggest to reduce the dimensionality of your timeseries. Have a look at SAX it decompresses your timeseries into string characters and still maintains the behaviour. Afterwards you can simply use any kind of clustering - also DTW for sure, it should be considerably fasterShea
P
9

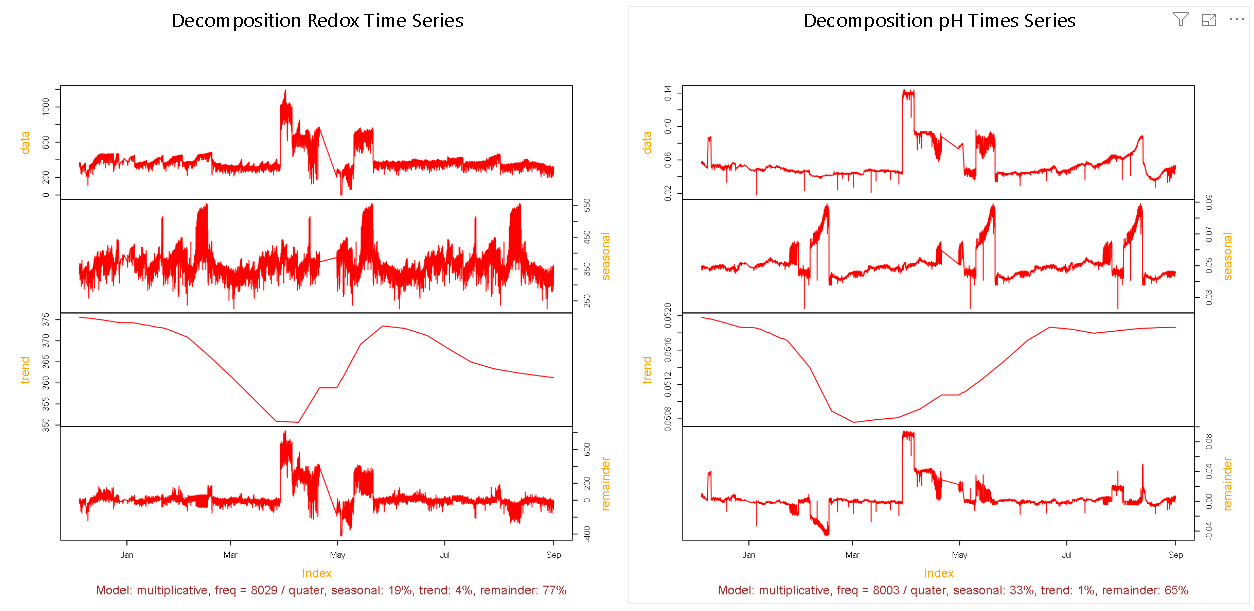
ARIMA can do the job, if you decompose the time series into trend, seasonality and residuals. After that, use a K-Nearest Neighbor algorithm. However, computational cost may be expensive, basically due to ARIMA.

In ARIMA:

from statsmodels.tsa.arima_model import ARIMA

model0 = ARIMA(X, dates=None,order=(2,1,0))
model1 = model0.fit(disp=1)

decomposition = seasonal_decompose(np.array(X).reshape(len(X),),freq=100)
### insert your data seasonality in 'freq'

trend = decomposition.trend
seasonal = decomposition.seasonal
residual = decomposition.resid

As a complement to @Sushant comment, you decompose the time series and can check for similarity in one or all of the 4 plots: data, seasonality, trend and residuals.

ARIMA

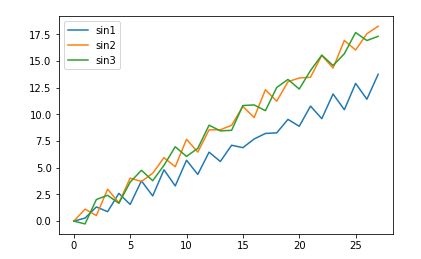
Then an example of data:

import numpy as np
import matplotlib.pyplot as plt
sin1=[np.sin(x)+x/7 for x in np.linspace(0,30*3,14*2,1)]
sin2=[np.sin(0.8*x)+x/5 for x in np.linspace(0,30*3,14*2,1)]
sin3=[np.sin(1.3*x)+x/5 for x in np.linspace(0,30*3,14*2,1)]
plt.plot(sin1,label='sin1')
plt.plot(sin2,label='sin2')
plt.plot(sin3,label='sin3')
plt.legend(loc=2)
plt.show()

Sine

X=np.array([sin1,sin2,sin3])

from sklearn.neighbors import NearestNeighbors
nbrs = NearestNeighbors(n_neighbors=2, algorithm='ball_tree').fit(X)
distances, indices = nbrs.kneighbors(X)
distances

You will get the similarity:

array([[ 0.        , 16.39833107],
       [ 0.        ,  5.2312092 ],
       [ 0.        ,  5.2312092 ]])
Predispose answered 14/10, 2019 at 20:29 Comment(1)
Hi, You didn't mention the use of the decomposition. I'm assuming you mean to say that we can calculate the similarity in trends of different datapoints and also for seasonality separately?Cure

© 2022 - 2024 — McMap. All rights reserved.