How to interpret ObservableHq simple algorithms as reusable code snippets?
Asked Answered
K

2

7

The main source of D3js solutions is observableHq.com, but seems impossible (?) to reuse algorithms by copy/paste... Is it? Even checking tutorials like this, there are no simple way (with less plugins or programmer's time-consumtion!) to check and reuse.

Example: I need a fresh 2020 D3js v5 algorithm for indented-tree visualization, and there are a good solution: observableHq.com/@d3/indented-tree.
The download is not useful because is based on complex Runtime class...

But, seems a simple chart-builder algorithm,

chart = {  // the indented-tree algorithm
  const nodes = root.descendants();
  const svg = d3.create("svg")// ...
  // ...
  return svg.node();
}

Can I, by simple human step-by-step, convert it in a simple HTML, with no complex adaptations, that starts with <script src="https://d3js.org/d3.v5.min.js"></script> and ends with no Runtime class use?


More details as example

Imagining my step-by-step for the cited indented-tree algorithm, that I can't finesh and need your help:

Suppose to start with a clean HTML5 template. For example:

<!DOCTYPE html>
<head>
    <meta charset="utf-8">
    <title>Indented Tree</title>
    <script src="https://d3js.org/d3.v5.min.js"></script>
    <script>
    function onLOAD() {
        console.log("Hello onLoad!")
        // all copy-paste and adaptations HERE.
        console.log("!Bye!")
    } // \onLOAD
    </script>
</head>
<body onload="onLOAD()">
  <script>
    console.log("Hello!")
    // global INITIALIZATIONS HERE.
  </script>
</body>
</html>
  1. Prepare global variables, seems root, nodeSize=17, and width

  2. Prepare data... JSON data is at the ugly ./files/e6537420..., I moved to project's root with it's real name, flare-2.json.

  3. Simple and classical D3js way to read JSON data: d3.json("./flare-2.json").then( data=> console.log(data) );
    Must test and check no CORS error, etc.

  4. Prepare data as root variable. All into the data => {} block to avoid sync problems...
    Seems that root is based in function(d3,data) { let i = 0; return d3.hierarchy(data).eachBefore(d => d.index = i++); }.

  5. Copy-paste chart = cited above, after root inicialization with data.

  6. ...


FAQ

On-comments questions, and answers:

@Mehdi   -   Could you explain what the problem is with including the D3 script tag and using Runtime library in the code?

When the original ObservableHq algorithm is simple, I need another way, a simple way to reuse it, by copy/paste and minimal adaptations.

@Mehdi   -   Did you read the Downloading and embedding notebooks tutorial?

Yes, no news there: no "human instruction" about how to reuse code... Only "install it" and "install that". No instructions about "copy/paste and minimal adaptations" that I explained above.

(@nobody) - What you need as answer?

As I show above, a simple human-readable step-by-step procedure to convert... Ideally the final result can by tested, a proof that it works at, for example, JSFiddle, with the copy/paste code and some more adaptation lines to show your point.

Kauppi answered 20/3, 2020 at 10:35 Comment(5)
Did you read the Downloading and embedding notebooks tutorial?Paper
Could you explain what the problem is with including the d3 script tag and using runtime library in the code?Paper
Hi @Mehdi, thanks. I edited title and add FAQ... Please explain or change your "close vote".Kauppi
Thanks for the clarifications. I still don't get it. Why not copy pasting each cell individually, then?Paper
Hi @Mehdi, I edited again, see section "More details as example"Kauppi
P
8

November 2020 edit

Observable now has an embed feature, details in this page.

Original post

Here is a step-by-step process to port the linked observable chart into a self-hosted web page, by copy-pasting the code, and without having to use the observable runtime library.

Starting from an HTML page and a JavaScript file referenced in the HTML page. Assuming a web server is running and configured as suitable.

  1. Get the data.
  • In case you want to use your own data instead of the one used in the notebook, make the data file(s) available in a directory on your web server.
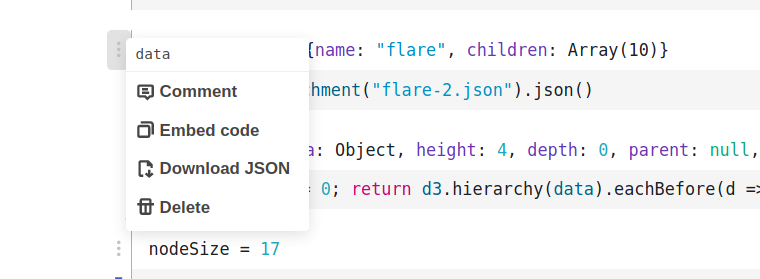
  • otherwise, download each input dataset attached to the notebook, using the Download JSON link from each data cell's menu.

screenshot of an observable notebook cell menu

  1. Load each dataset in the page using d3-fetch
d3.json("/path/to/data.json").then(function(data) {
  console.log(data); // [{"Hello": "world"}, …]
});
  1. Get the content of each cell containing a variable or a function in the notebook, and put then inside the.then function from previous step. This notebook visualizer tool can be helpful to identify the relevant cells.

  2. Adapt the syntax of the functions just copied as suitable. For example, the following notebook cell:

root = { let i = 0; return d3.hierarchy(data).eachBefore(d => d.index = i++); }

could be transformed to:

function getRoot(){
   let i = 0;
    return d3.hierarchy(data).eachBefore(d => d.index = i++);
}

root = getRoot()
  1. If needed by some function from the notebook, define a variable width, and initialize it with the desired value.

  2. adapt the DOM manipulation code in order to append elements to the DOM, rather than relying on the implicit execution by observable runtime.

Demo in the snipped below:

d3.json("https://rawcdn.githack.com/d3/d3-hierarchy/46f9e8bf1a5a55e94c40158c23025f405adf0be5/test/data/flare.json").then(function(data) {

  const width = 800
    , nodeSize = 17
    , format = d3.format(",")
    , getRoot = function(){
       let i = 0;
        return d3.hierarchy(data).eachBefore(d => d.index = i++);
    }
    , columns = [
      {
        label: "Size", 
        value: d => d.value, 
        format, 
        x: 280
      },
      {
        label: "Count", 
        value: d => d.children ? 0 : 1, 
        format: (value, d) => d.children ? format(value) : "-", 
        x: 340
      }
    ]
    , root = getRoot()
    , chart = function() {
      const nodes = root.descendants();

      const svg = d3.select('#chart')
          .attr("viewBox", [-nodeSize / 2, -nodeSize * 3 / 2, width, (nodes.length + 1) * nodeSize])
          .attr("font-family", "sans-serif")
          .attr("font-size", 10)
          .style("overflow", "visible");


  const link = svg.append("g")
      .attr("fill", "none")
      .attr("stroke", "#999")
    .selectAll("path")
    .data(root.links())
    .join("path")
      .attr("d", d => `
        M${d.source.depth * nodeSize},${d.source.index * nodeSize}
        V${d.target.index * nodeSize}
        h${nodeSize}
      `);

      const node = svg.append("g")
        .selectAll("g")
        .data(nodes)
        .join("g")
          .attr("transform", d => `translate(0,${d.index * nodeSize})`);

      node.append("circle")
          .attr("cx", d => d.depth * nodeSize)
          .attr("r", 2.5)
          .attr("fill", d => d.children ? null : "#999");

      node.append("text")
          .attr("dy", "0.32em")
          .attr("x", d => d.depth * nodeSize + 6)
          .text(d => d.data.name);

      node.append("title")
          .text(d => d.ancestors().reverse().map(d => d.data.name).join("/"));

      for (const {label, value, format, x} of columns) {
        svg.append("text")
            .attr("dy", "0.32em")
            .attr("y", -nodeSize)
            .attr("x", x)
            .attr("text-anchor", "end")
            .attr("font-weight", "bold")
            .text(label);

        node.append("text")
            .attr("dy", "0.32em")
            .attr("x", x)
            .attr("text-anchor", "end")
            .attr("fill", d => d.children ? null : "#555")
          .data(root.copy().sum(value).descendants())
            .text(d => format(d.value, d));
      }

  }

  chart()
    
}).catch(function(err) {
  console.log('error processing data', err)
})
<script src="https://cdnjs.cloudflare.com/ajax/libs/d3/5.8.0/d3.min.js"></script>
<svg id = 'chart'></svg>
Paper answered 22/3, 2020 at 21:55 Comment(2)
Hi Mendi, thanks, a recipe for humans! To be perfect, perhaps you can include an ObservableHq helper, the notebook-visualizer: in this case notebook-visualizer-with indented-tree... A citation at your itens 1 and/or 4. PS: it is interesting also to cite in a postscript the name of this methodology (now I see after @cal_br_mar cited Severo's "rewrite from scratch" methodology).Kauppi
ok, I just added a link to the notebook visualizer in the answer.Paper
G
1

The very simple way would be using their runtime embed version. Here is a very similar way to reuse the notebook in a HTML5 template.

You can also download the runtime and the notebook js to host on your server.

The trick here is to use the runtime to talk to Observable reactive cells.

In this example I'm using d3.json to fetch new json data and redefine the data cell from the original notebook.

<div id="observablehq-e970adfb"></div>
<script src="https://d3js.org/d3.v5.min.js"></script>
<script type="module">

//Import Observable Runtime

import {Runtime, Inspector} from "https://cdn.jsdelivr.net/npm/@observablehq/runtime@4/dist/runtime.js";
import define from "https://api.observablehq.com/@d3/indented-tree.js?v=3";
const inspect = Inspector.into("#observablehq-e970adfb");

// Notebook instance
const notebook =(new Runtime).module(define, name => (name === "chart") && inspect());


// Using D3.json to load new Json Data

d3.json("https://gist.githubusercontent.com/radames/9018398d6e63bcaae86a0bf125dc6973/raw/33f19a49e1123a36e172cfc7483f0a444caf6ae3/newdata.json").then((newdata) =>{
  
  // When data is loaded you can use notebook to redefine a cell
  // In this case the data cell, where in the notebook it's using a FileAtachent
  // Here you can redefine with any structure hierarchy structure like
  
  notebook.redefine("data", newdata);
})


</script>

Editing to add steps using Severo's project

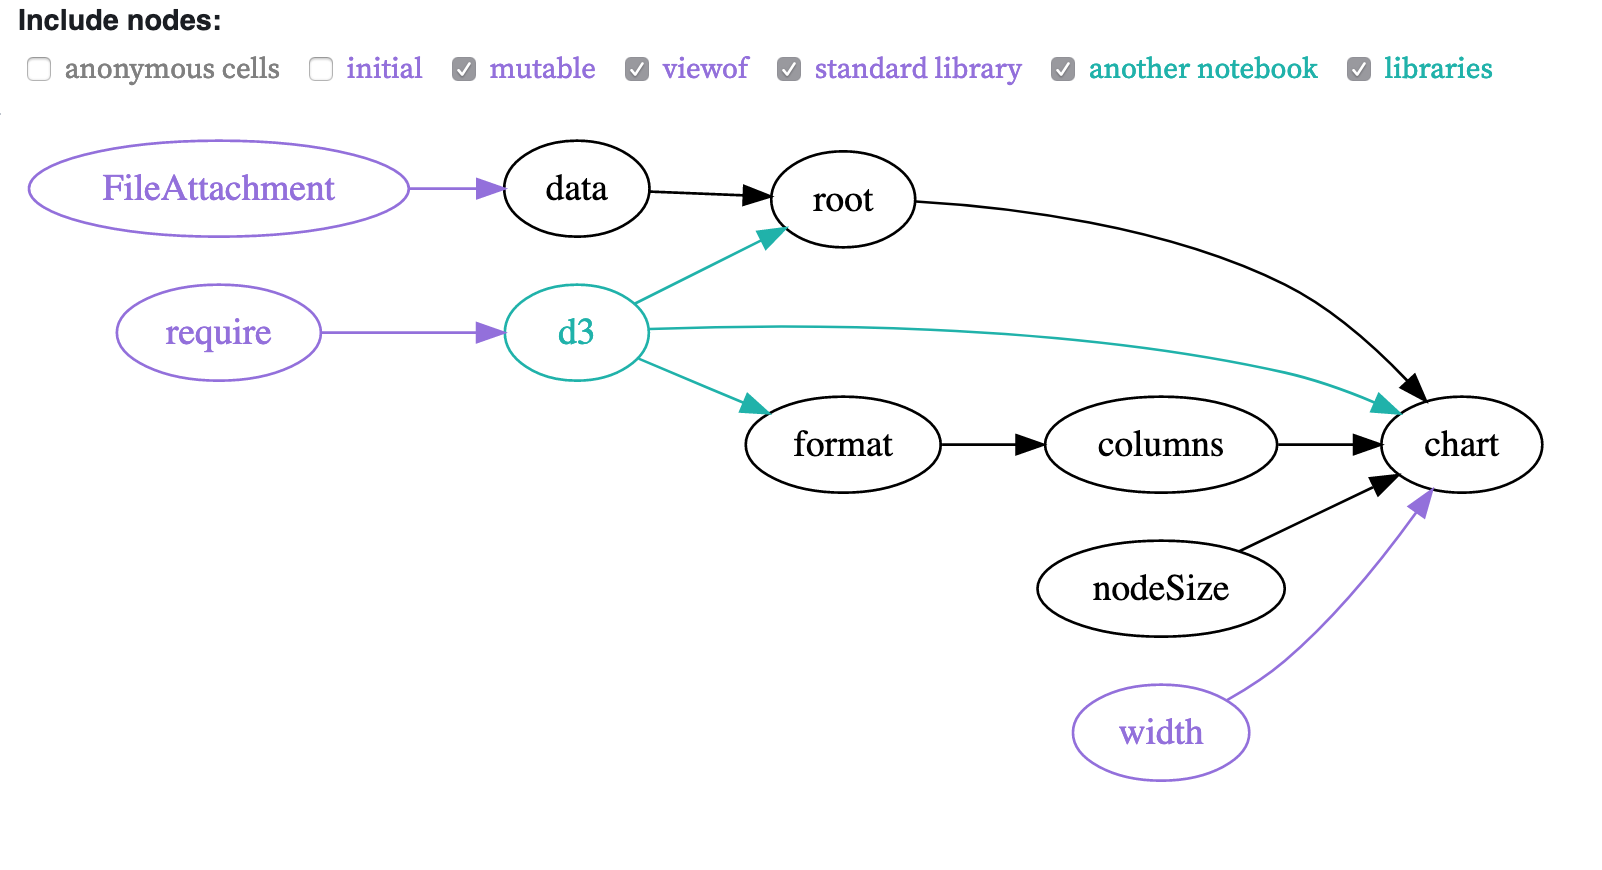
Using Severo's Notebook visualizer you can understand your notebook's dataflow and rewrite your standalone code. Keep in mind that rewriting from scratch might become very complicated as your code uses Observable features such as reactivity and state management. In that case I recommend you to use Observable runtime following my response above.

Now with that in mind, let's look at the visualizer and follow Severo's intructions

enter image description here

  • Green cells correspond to external code imported into the notebook: library imported with require (e.g. d3 = require("d3@5")): you typically will install it in your project with npm install, and
    then import it as an ES module imported notebook (e.g. import { radio } from "@jashkenas/inputs"): you will have to repeat the same process in
    this notebook, examining its own dependency graph.
  • Gray cells are anonymous (non-named) cells and will generally not be migrated. They often contain explanation texts, and no other cell can depend on them, so they shouldn't break the code if
    removed. But, be careful: if your main chart cell is not named, you
    will still want to copy its code.
  • Black cells are the actual notebook code written by the user, and you will want to copy it to your project.
  • Purple cells are the toughest ones. They correspond to features of Observable that will typically be used a lot by a notebook writer (see the Standard Library), and their migration to a standalone application can be the hardest part of the rewrite from scratch, particularly mutable and viewof cells, since they manage an internal state.

Here is the code converted following these instructions

<!--- Green Cells / Imports --->
<script src="https://d3js.org/d3.v5.min.js"></script>

<!--- Char Container --->

<div class="chart"></div>
<script>
  // Run main function
  main();

  // async main so we can run our code like Observable cell by cell
  async function main() {
    // as in Observable each cell runs as an async function
    // so here you can await the output to continue
    const data = await d3.json("https://gist.githubusercontent.com/radames/9018398d6e63bcaae86a0bf125dc6973/raw/33f19a49e1123a36e172cfc7483f0a444caf6ae3/newdata.json");

    // run complex code as inline await / async
    const root = await (async() => {
      let i = 0;
      return d3.hierarchy(data).eachBefore(d => d.index = i++);
    })()

    // easy constant
    const nodeSize = 17;

    // easy constant function
    const format = d3.format(",");

    // easy constant
    const columns = [{
        label: "Size",
        value: d => d.value,
        format,
        x: 280
      },
      {
        label: "Count",
        value: d => d.children ? 0 : 1,
        format: (value, d) => d.children ? format(value) : "-",
        x: 340
      }
    ];
    // on Observable width is reactive, here we have to do it manually
    const width = window.innerHTML;

    window.addEventListener('resize', updateWidth);

    function updateWidth() {
      // update your chart on resize event
    }
    // inline function gets chart svg node
    const chart = (() => {
      const nodes = root.descendants();

      const svg = d3.create("svg")
        .attr("viewBox", [-nodeSize / 2, -nodeSize * 3 / 2, width, (nodes.length + 1) * nodeSize])
        .attr("font-family", "sans-serif")
        .attr("font-size", 10)
        .style("overflow", "visible");

      const link = svg.append("g")
        .attr("fill", "none")
        .attr("stroke", "#999")
        .selectAll("path")
        .data(root.links())
        .join("path")
        .attr("d", d => `
          M${d.source.depth * nodeSize},${d.source.index * nodeSize}
          V${d.target.index * nodeSize}
          h${nodeSize}
        `);

      const node = svg.append("g")
        .selectAll("g")
        .data(nodes)
        .join("g")
        .attr("transform", d => `translate(0,${d.index * nodeSize})`);

      node.append("circle")
        .attr("cx", d => d.depth * nodeSize)
        .attr("r", 2.5)
        .attr("fill", d => d.children ? null : "#999");

      node.append("text")
        .attr("dy", "0.32em")
        .attr("x", d => d.depth * nodeSize + 6)
        .text(d => d.data.name);

      node.append("title")
        .text(d => d.ancestors().reverse().map(d => d.data.name).join("/"));

      for (const {
          label,
          value,
          format,
          x
        } of columns) {
        svg.append("text")
          .attr("dy", "0.32em")
          .attr("y", -nodeSize)
          .attr("x", x)
          .attr("text-anchor", "end")
          .attr("font-weight", "bold")
          .text(label);

        node.append("text")
          .attr("dy", "0.32em")
          .attr("x", x)
          .attr("text-anchor", "end")
          .attr("fill", d => d.children ? null : "#555")
          .data(root.copy().sum(value).descendants())
          .text(d => format(d.value, d));
      }

      return svg.node();
    })()

    // select element container append chart
    const container = document.querySelector(".chart")
    container.appendChild(chart);

  }
</script>
Greenockite answered 23/3, 2020 at 21:30 Comment(7)
Hi Cal, this is near the same to click "Download code" in the notebook site... As I commented the use of the runtime.js creates a black box that I need to avoid... And comparing with @Paper solution, with runtime the performance is worst... Can you explain an advantage of your approach?Kauppi
Hi, the runtime is not a black box, source-code, github.com/observablehq/runtime it's a lightweight javascript flavor parser, it comes with the reactivity benefits. I'm not so sure about performance. Other resources that might be useful github.com/asg017/unofficial-observablehq-compiler and github.com/severo/observable-to-standaloneGreenockite
Hi @car_br_mar, thanks for your last link, the answer is there (!)... Can you edit your answer adding a new section with some summary of the "rewrite from scratch" method, and illustrating its use by the indented-tree example?Kauppi
You can use the Notebook Visualizer in the illustration (!).Kauppi
Thanks cal_br_mar (!). PS: with edition your answer can get half bounty... But sorry, I selected the other some hours ago.Kauppi
I've updated with that, keep in mind this code was relative easy to rewrite, however if you're using most cool features from Observable runtime, that translation won't be easier anymore. I still recommend using Observable runtime it's very lightweight and it runs on most modern browsers.Greenockite
Perpect, thanks! About the use of Observable runtime in complex interfaces, it seems better (more simple) tham use react-d3-library.github.ioKauppi

© 2022 - 2024 — McMap. All rights reserved.