Why is Largest Contentful Paint almost 4 seconds?
Asked Answered
O

1

7

I don't understand which element on the mobile version of https://www.openstream.ch is considered to be the Largest Contentful Paint by Lighthouse.

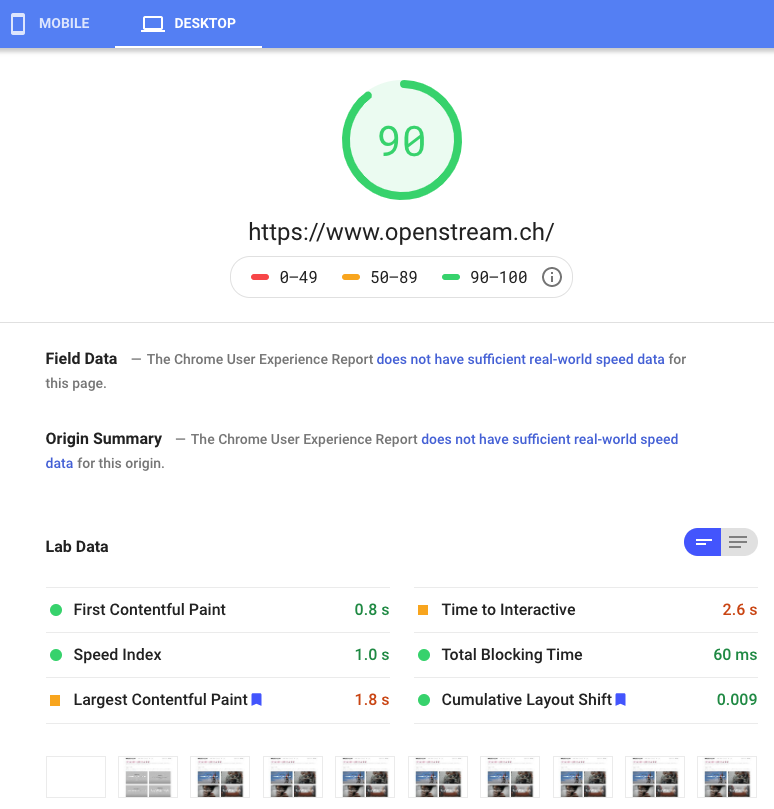
When I test the current version of the website with PageSpeed Insights (currently running on Lighthouse v6.0.0), it has 90 points for desktop with 1.8s to render the Largest Contentful Paint which seem to be the 4 images at the bottom of the view port:

Screenshot Google PageSpeed Insights Desktop

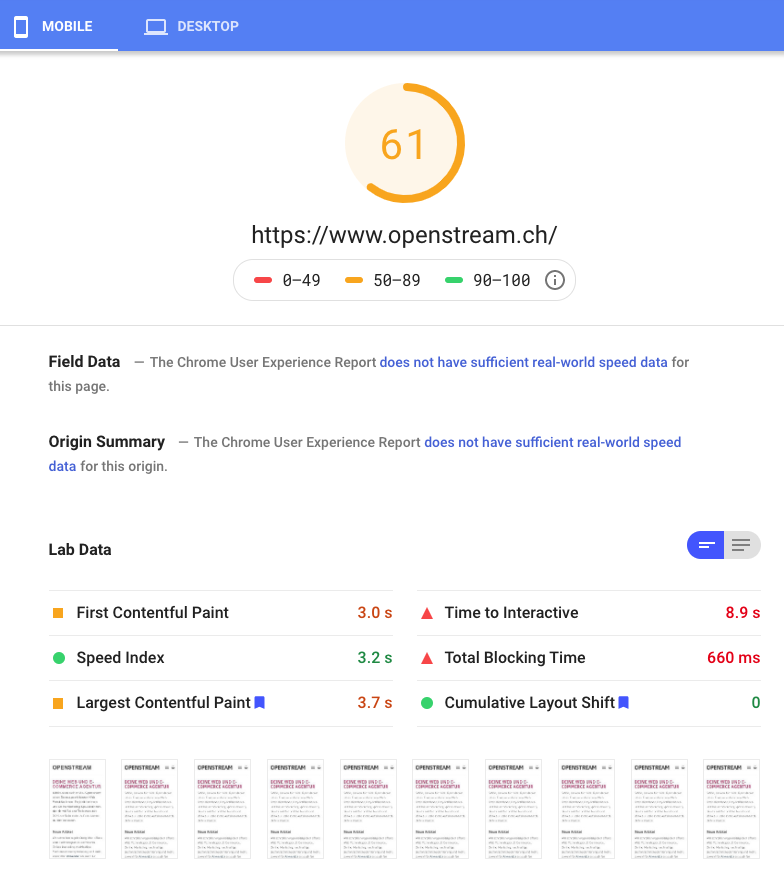
When I switch to the mobile results it has 61 points with 3.7s to render the Largest Contentful Paint, although there is not even an image in the view port:

Screenshot Google PageSpeed Insights Mobile

On https://web.dev/lcp/ it says that the types of elements currently considered for Largest Contentful Paint are:

  • <img> elements
  • <image> elements inside an element
  • <video> elements (the poster image is used)
  • An element with a background image loaded via the url() function (as opposed to a CSS gradient)
  • Block-level elements containing text nodes or other inline-level text elements children.

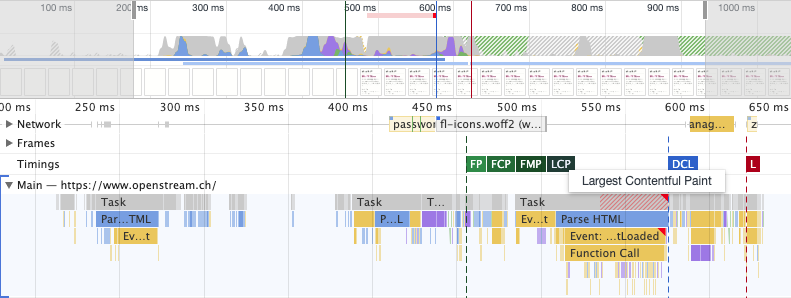
When I do the test in the latest version of Chrome for macOS (Lighthouse 5.7.1) the Largest Contentful Paint is rendered after around 0.5s:

Screenshot Google Chrome macOS Lighthouse Trace

Is this a bug in Lighthouse 6.0.0 or does it probably have another reason?

Oneway answered 11/6, 2020 at 15:16 Comment(2)
when you tested this did you test the mobile view to get the above profile by any chance?Bastardy
Nevermind i can see from the timeline you did, I will answer now for you :-)Bastardy
B
9

You have missed an important part of how Lighthouse (the engine behind Page Speed Insights (PSI)) works.

When running the test for a mobile PSI simulates a 4x CPU slowdown and a 4G connection.

To simulate this while profiling you need to change the "Network" to "Fast 3G" (this is close enough, for more accuracy you can go in set up a profile for 4G which is the same as PSI - see below) and change "CPU" to "4x slowdown".

If you run the profiling again with these settings you will see that it takes just over 3 seconds to render the page and then very shortly after you get the fonts loading in, which is when the largest contentful paint happens.

The image below shows the location of the settings (right hand side)

Image showing the location of the Network and CPU settings

How to set your network profile the same as Page Speed Insights

Page Speed Insights use the same settings as Lighthouse as I said earlier. You can find the config they currently use here.

From this we can see that they use throttling.mobileSlow4G as the default which can be set as follows:-

Download: 1.6 * 1024 * 0.9 = 1474 kbps.

Upload: 750 * 0.9 = 675 kbps.

latency: 150 * 3.75 = 562.5ms.

If you set up a profile (go to "Network" -> "Custom" -> "Add") with the above settings and call it something like "Page Speed Insights Throttle Settings" you can then use this to run a very similar profile.

An alternative way to get the profiling data

The trace that is produced in Developer Tools > Audits can be made to generate an accurate trace by clicking on the settings gear (top right of the audits panel) and unchecking "Simulated throttling" in the small bar that appears.

If you then run your audit (it will take longer as it applies the throttling now instead of simulating it). you can then access the trace that matches your report by clicking the "View Trace" button, which is located just above the photo timeline / below "Time to Interactive".

Bastardy answered 11/6, 2020 at 15:57 Comment(6)
Thanks for your answer. I created a new network profile and now see that LCP both in Lighthouse 5.7.1 and 6.0.0 is over 3s for the mobile version of openstream.ch. I did the same with sandbox.openstream.ch which uses a light weight WordPress theme without jQuery. Lighthouse 5.7.1 shows a 99 points rating (LCP=150ms), Lighthouse 6.0.0 only 83 (LCP=4.5s).Oneway
I just downloaded Chrome Beta 84 which already uses Lighthouse 6.0.0 and there the difference on mobile is not so extreme. On mobile it's 95 as compared to 98 points, both with network set to "Slow 3G". This seems to confirm that something with the PageSpeed website is either wrong or different.Oneway
Here's a screenshot with some more details opnstre.am/37WkzGf.Oneway
This is so confusing. Switched to another lightweight WordPress theme and now get both 98 points on mobile both with Lighthouse 5.7.1 and 6.0.0 opnstre.am/3dmEIX2.Oneway
Geographic distance is the only thing I can suggest. Either that or you don't have "clear storage" checked on the audits tab. I cannot access "sandbox.openstream.ch" so can't see if something is different there. Timings and scores are consistent for me at 77, 76, 77 but I am in UK. Also I think I confused you, your network settings have nothing to do with the audits (lighthouse) tab, those only affect the performance tab. I was merely demonstrating the same settings so you know how the mobile report works.Bastardy
Thanks for clarifying.Oneway

© 2022 - 2024 — McMap. All rights reserved.