I have a Spark Streaming application and a Kafka Streams application running side by side, for benchmarking purposes. Both consume from the same input topic and write to different targets databases. Input topic has 15 partitions, both spark streaming and kafka streams have 15 consumers (1:1 ratio). In addition, event payloads are around 2kb. Not sure if it's relevant, but the 90% percentile Execution time for Spark Streaming is around 9ms. Kafka Streams, 12ms. commit() method is invoked in my Processor every time a message is processed.
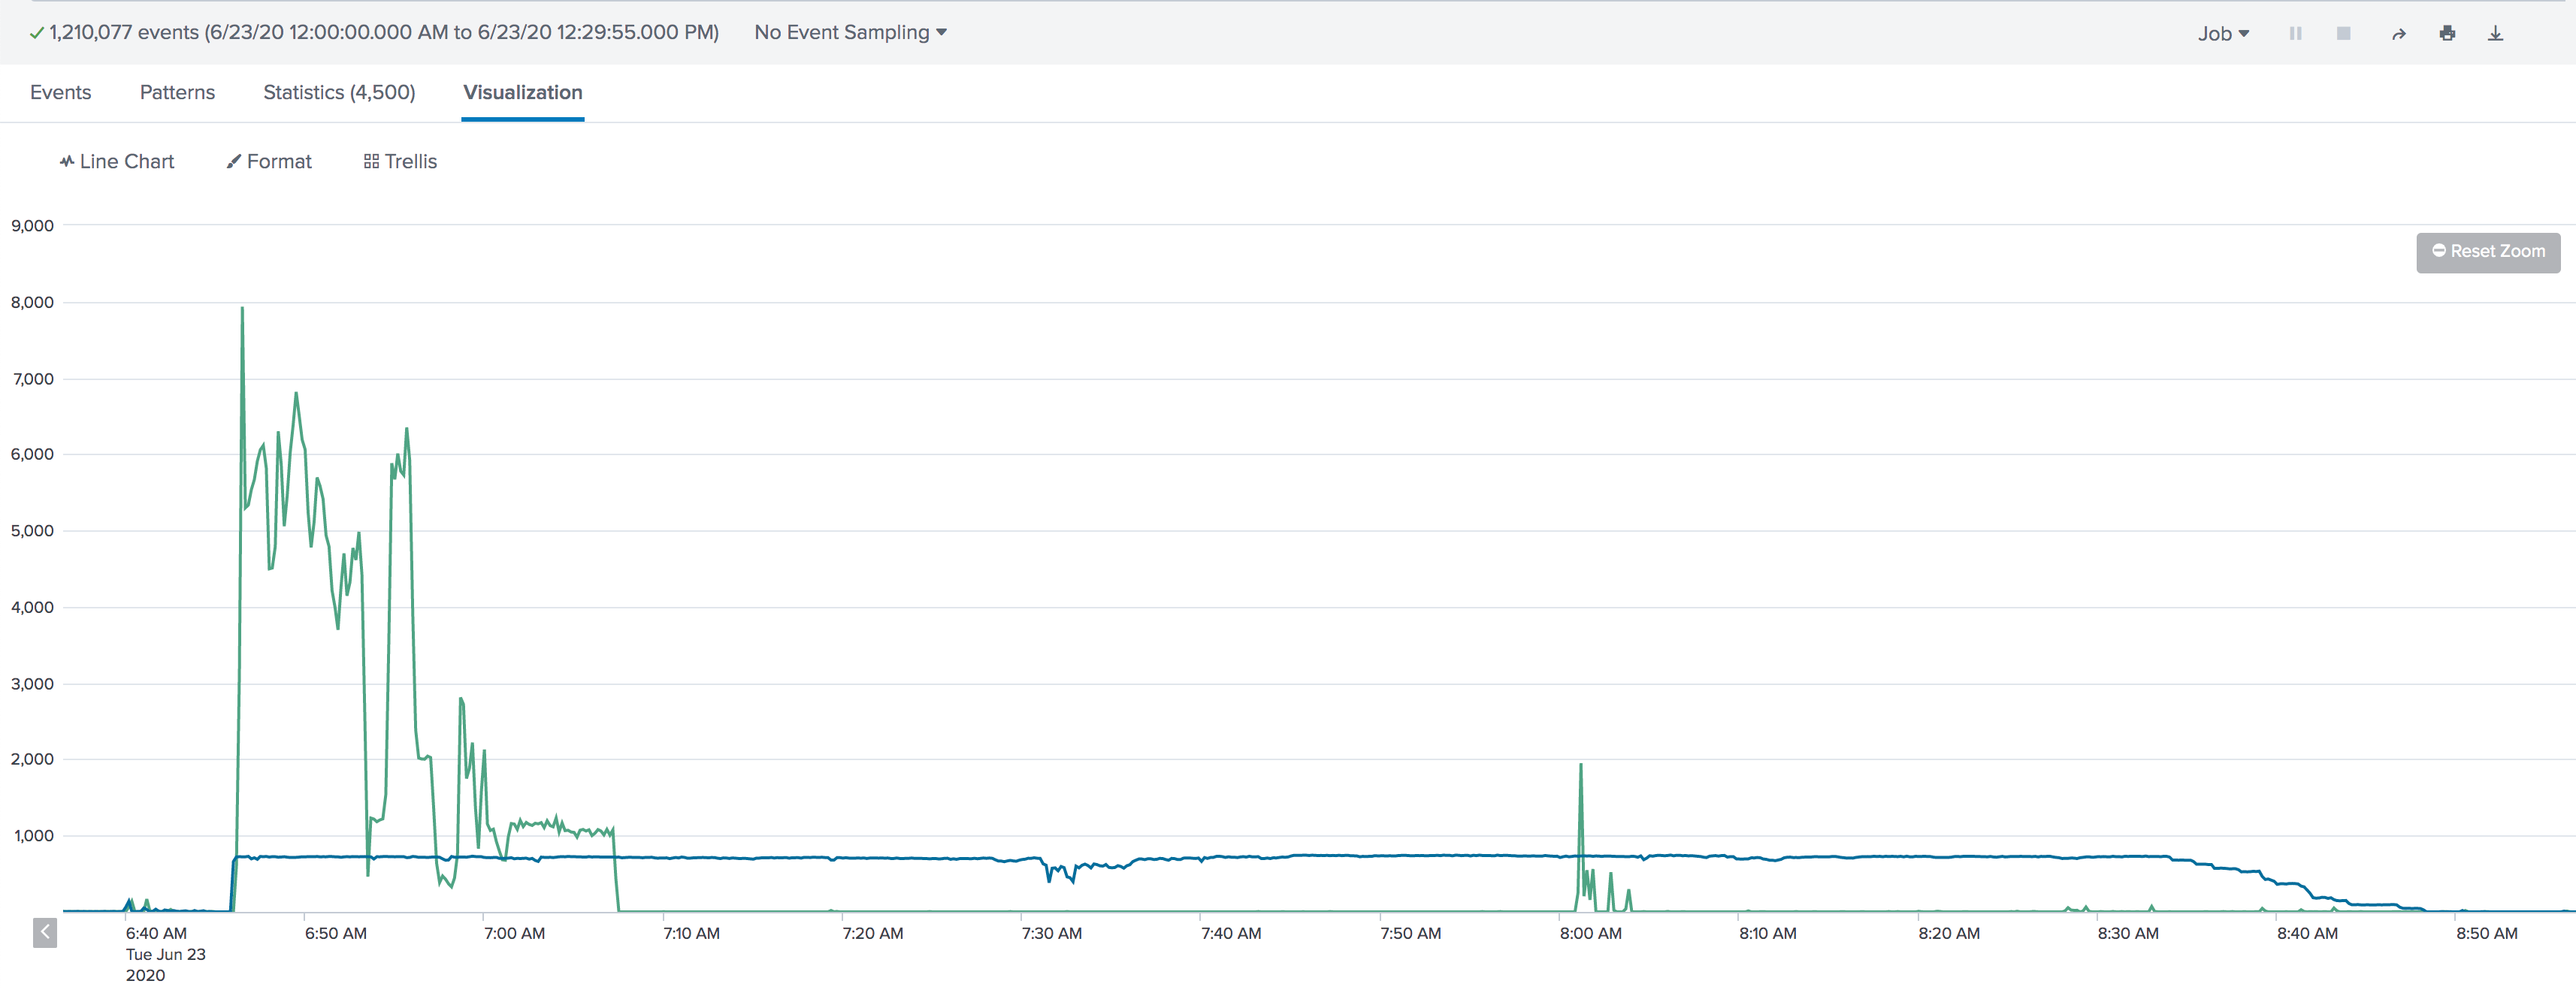
The problem relies on high bursts. Spark Streaming can keep up with 700 per second, while Kafka Streams, around 60/70 per second only. I can't go beyond that. See graph below: (Green Line - Spark Streaming / Blue line - Kafka Streams)
As per config below, as long as it doesn't exceed 1000 events per consumer, considering the backpressure, spark streaming can keep up, regardless of the number of bytes per partition. As for Kafka Streams, if I understood its configs correctly (and please keep me honest), based on the same below, I am able to fetch a max of 1000 records (max.poll.records) every 100ms (poll.ms), as long as it doesn't exceed 1MB per partition (max.partition.fetch.bytes) and 50MB per fetch (fetch.max.bytes).
I see the same results (stuck on 70 events per second), regardless if I am using 5, 10 or 15 consumers, which drives me to think it is config related. I tried to tweak these by increasing the number of records per fetch and max bytes per partition, but i didn't get a significant result.
I am aware these are different tech and used for different purposes, but I am wondering what values I should use in Kafka Streams for better throughput.
Spark Streaming config:
spark.batch.duration=10
spark.streaming.backpressure.enabled=true
spark.streaming.backpressure.initialRate=1000
spark.streaming.kafka.maxRatePerPartition=100
Kafka Streams Config (All bytes and timing related)
# Consumer Config
fetch.max.bytes = 52428800
fetch.max.wait.ms = 500
fetch.min.bytes = 1
heartbeat.interval.ms = 3000
max.partition.fetch.bytes = 1048576
max.poll.interval.ms = 300000
max.poll.records = 1000
request.timeout.ms = 30000
enable.auto.commit = false

# StreamsConfig
poll.ms=100
Processor Code
public class KStreamsMessageProcessor extends AbstractProcessor<String, String> {

    private ProcessorContext context;

    @Override
    public void init(ProcessorContext context) {
        this.context = context;
    }

    @Override
    public void process(String key, String payload) {

        ResponseEntity responseEntity = null;
        try {

          // Do Some processing

        } catch (final MyException e) {

          // Do Some Exception Handling

        } finally {

            context.forward(UUID.randomUUID().toString(), responseEntity);
            context.commit();
        }
    }
Thanks in advance!


enable.auto.commit). I'm also surprised you consume 70 events regardless then number of consumers... I wonder if all records end up going to the same partition, can you verify that the load is balanced between all the partitions? Looking at the code might also help! And maybe the topic configuration too. – Lashley