Set pre-defined node styles?
Asked Answered
G

3

7

I've been googling around for the last 15 minutes trying to find an answer to this. But I can't seem to figure it out.

I was tasked with building some small flowcharts for some applications I've developed at work. They don't need anything fancy because they are going to convert it into their preferred format in vizio. They even said we could do it pen and paper. So I figured I would play around with graphviz/dot.

They have 6 pre-defined shapes/colors that they like to use, so I figured I would use them. I've already built them all in dot...but if I plan to re-use them many times, I'd like to find a way to save them as a sort of template.

Is that possible?

For example...These are the predefined shapes.

digraph G {
    node [color="#4271C6"]

    process [
        shape=Mrecord,
        style=filled, fillcolor="#E1F4FF",
        label="{1. Process\l | Description}"];

    subprocess [
        shape=record,
        style=filled, color="#FFFFFF", fillcolor="#A5A5A5",
        label="| Sub-Process |"];

    database [
        shape=cylinder, color="#18589A",
        label="Database"];

    inputoutput [
        shape=polygon,
        style=filled, fontcolor=white,
        fixedsize=true, skew=0.3, margin=0,
        width=2, label="Input / Output"];

    file [
        shape=folder,
        label="File"];

    external [
        shape=box3d,
        label="External entity"];
}

Nodes produced from above code

Grati answered 28/7, 2020 at 18:47 Comment(4)
You can use subgraphs/clusters to give a group of nodes the same style, see graphviz.org/Gallery/directed/cluster.htmlEphraim
Maybe I'm misunderstanding, but I'm not sure that applies to what I'm asking? I'm asking if there is a way to re-use the shapes I've laid out above without having to copy-paste the entire node each time? Or are you saying to create all of my nodes, and then use clusters for defining their styling (aka, cluster_file, cluster_database, etc)? That could work, until I need to use clusters for layout. Unless it lets you place nodes into multiple clusters without duplicating the display.Grati
Yes, you create clusters for each style and add the nodes in them. Not sure if you can place nodes in multiple clusters.Ephraim
Thanks for your tip. While I didn't use it exactly, it led me to the answer. Apparently you can have a single node exist in multiple subgraphs. I started with that and separated visual settings and labels. Then I tested it without the subgraphs and that works too! Check out my answer that I've added. Works pretty well. Thanks!Grati
G
6

Okay, so I figured it out. I didn't realize you could do this...but apparently you can break up a node definition into multiple parts...so this is what I came up with, which solves my problem...

I have a "Styles" section that goes at the top. Here I can define each node style. I use comments as a way of naming them. And I don't need to copy paste, because I can just define multiple nodes as a comma separated list.

I also found that you can put them into subgraphs as well, like subgraph style_file {...}. But it seemed simpler to just use a comment as a way to name the style.

digraph G {
    newrank=true;

    ///////////////////////////////////////////////////////////
    // Styles
    ///////////////////////////////////////////////////////////
        node [color="#4271C6"];
        edge [color="#4271C6"];

        //process
            createfile, uploadfile
            [shape=Mrecord, style=filled, fillcolor="#E1F4FF"];
        //subprocess
            exportfile, wait
            [shape=record, style=filled, color="#FFFFFF", fillcolor="#A5A5A5"];
        //external
            ftp
            [shape=box3d];
        //datastore
            database
            [shape=cylinder, color="#18589A"];
        //io
            exportproc
            [shape=polygon, style=filled, fontcolor=white, margin=0, width=3.1, fixedsize=true, skew=0.3];
        //file
            workfile
            [shape=folder];

    ///////////////////////////////////////////////////////////
    // Clusters
    ///////////////////////////////////////////////////////////
        subgraph cluster_0 {
            createfile  [label="{1. Process\l | Create file}"];
            exportfile  [label="|Export Data\nfrom DB|"];
            database    [label="Database"];
            exportproc  [label="Export Data"];
            workfile    [label="Generated file\n(Archived on server)"];
        }

        subgraph cluster_1 {
            uploadfile  [label="{2. Process\l | Upload file}"];
            ftp         [label="FTP Server"];
            wait        [label="|Wait for\nresponse file|"];
        }

    ///////////////////////////////////////////////////////////
    // Relationships
    ///////////////////////////////////////////////////////////
        {
            rank=same;
            createfile;
            uploadfile;
        }

    ///////////////////////////////////////////////////////////
    // Relationships
    ///////////////////////////////////////////////////////////
        # cluster_0
        createfile -> exportfile;
        exportfile -> database;
        database   -> exportproc;
        exportproc -> workfile [style=dashed];

        workfile -> uploadfile;

        # cluster_1
        uploadfile -> ftp [style=dashed];
        ftp -> wait;
}

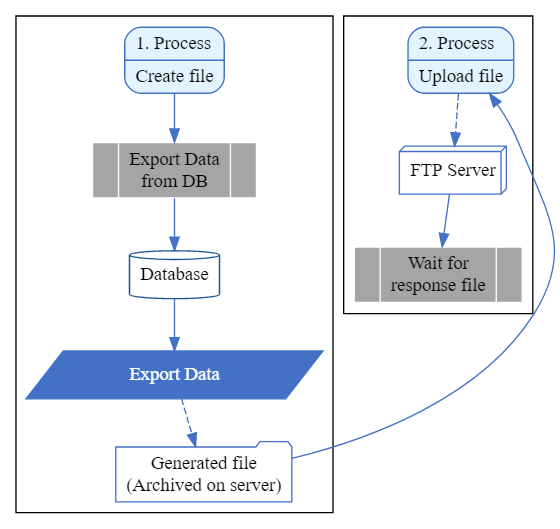
Which produces this:

enter image description here

Grati answered 28/7, 2020 at 23:47 Comment(0)
M
3

unfortunately there is no way to define macros or objects and reuse - especially across multiple graphs. However there are ways using other tools. Some folks use m4 (the macro language) or cpp (the C pre-processor) Both work, but there are potential OS issues. Python, awk, ... would also work.
Here is a gvpr program (gvpr is part of the Graphviz package) that also does what you want (I think):

 digraph pre{
  a [_type=process label="{1. Process\l | Something}"]
  b [_type=process label="{2. Process\l | Something else}"]
  c [_type=subprocess label="do it"]
  d [_type=database label="lots of data"]
  e [_type=database label="a bit of data"]
  f [_type=inputoutput label="inOut"]
  g [_type=file label="nail file"]
  h [_type=external label="outside"]  

 a->b->c->d->e->f->g->h
}

The gvpr program:

BEG_G{
  $G.newrank="true";
}
N{
  $.color="#4271C6";  // default
}
N[_type=="process"]{
  $.shape="Mrecord";
  $.style="filled";
  $.fillcolor="#E1F4FF";
  // maybe redo $.label
}
N[_type=="subprocess"]{
  $.shape="record";
  $.style="filled";
  $.color="#FFFFFF";
  $.fillcolor="#A5A5A5";
  $.label=sprintf("|%s|", $.label);  // embed in pipes
}
N[_type=="database"]{
  $.shape="cylinder";
  $.color="#18589A";
}
N[_type=="inputoutput"]{
  $.shape="polygon";
  $.style='filled';
  $.fontcolor="white",
  $.ixedsize="true";
  $.skew="0.3";
  $.margin="0";
  $.width="2";
}
N[_type=="file"]{
  $.shape="folder";
}
N[_type=="external"]{
  $.shape="box3d";
}

Produces:
enter image description here

There may currently be problems with gvpr on Windows, but I know the development team is working on it

Here is the command line:
gvpr -c -f predefined.gvpr predefined2.gv | dot -Tpng > predefined2.png

Manstopper answered 28/7, 2020 at 20:12 Comment(1)
Thanks for the tip, I'll have to look into this, never used gvpr before. Looks handy. FYI, I figured out an answer to my question, check it out.Grati
O
0

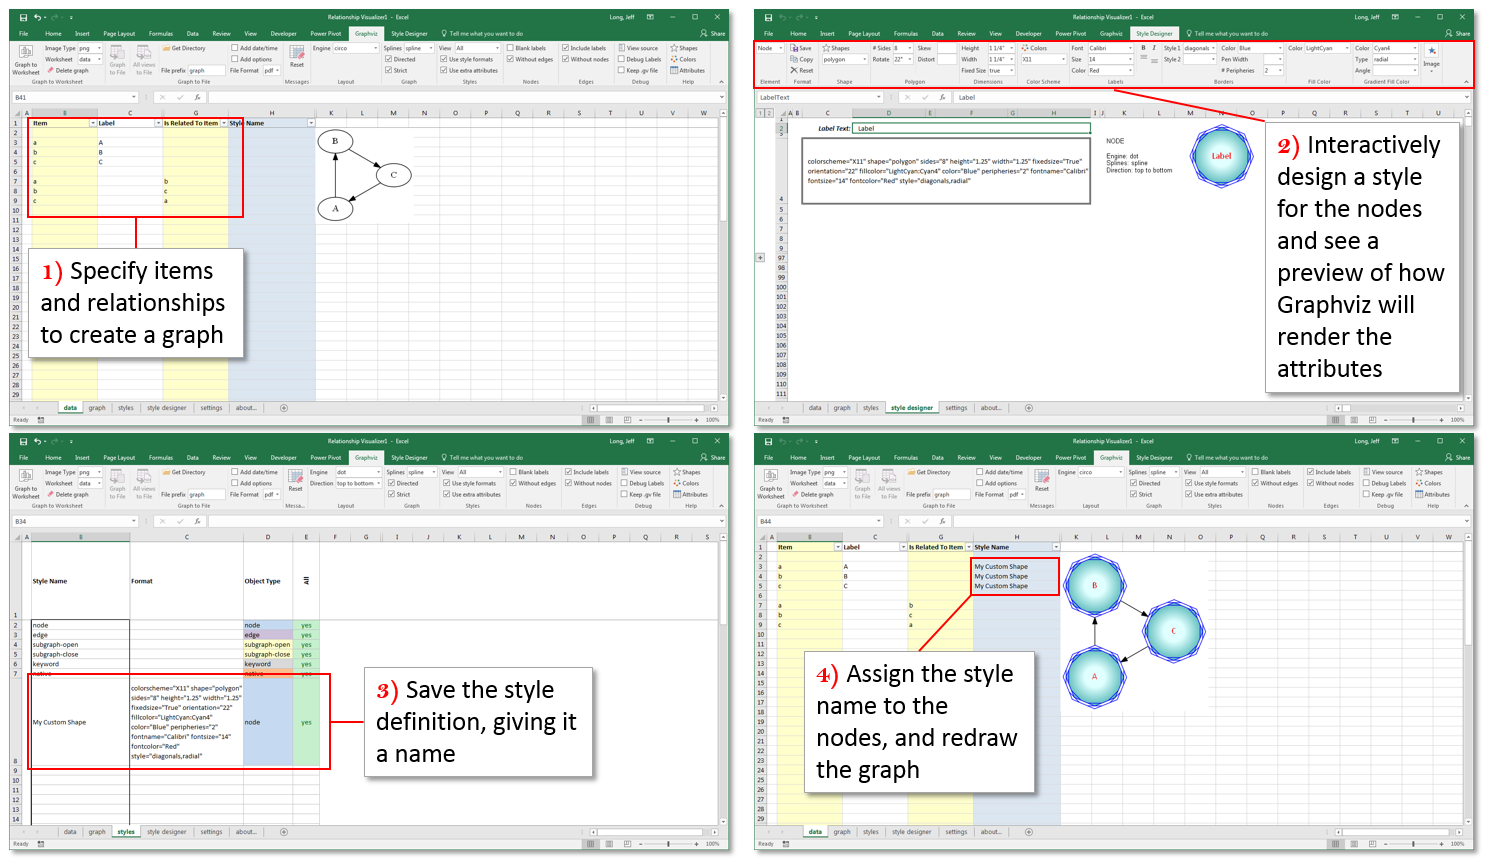
No affiliation, but the Excel to Graphviz application can create re-usable styles as can be seen in this screenshot:

enter image description here

Occasion answered 15/8, 2020 at 23:1 Comment(0)

© 2022 - 2024 — McMap. All rights reserved.