I've been reading about time-series decomposition, and have a fairly good idea of how it works on simple examples, but am having trouble extending the concepts.
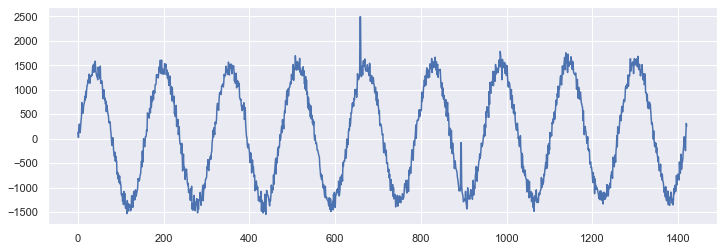
For example, some simple synthetic data I'm playing with:
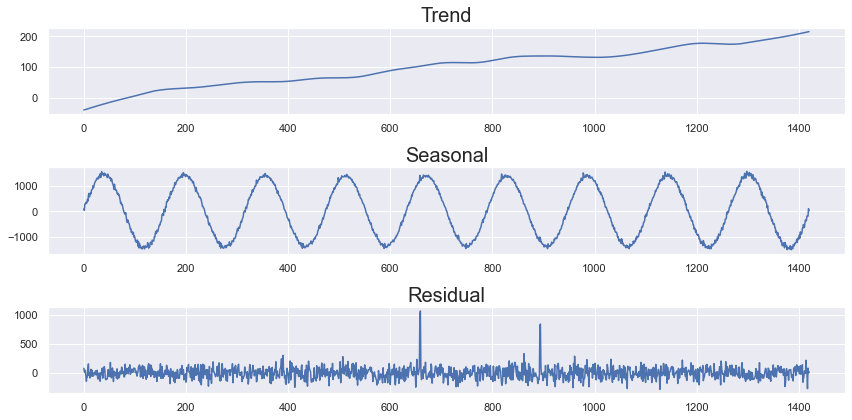
So there is no actual time associated with this data. It could be sampled every second or every year. Whatever the sampling frequency, the period is roughly 160 time steps, and using this as the period argument yields the expected results:
# seasonal=13 based on example in the statsmodels user guide
decomp = STL(synth.value, period=160, seasonal=13).fit()

fig, ax = plt.subplots(3,1, figsize=(12,6))
decomp.trend.plot(title='Trend', ax=ax[0])
decomp.seasonal.plot(title='Seasonal', ax=ax[1])
decomp.resid.plot(title='Residual', ax=ax[2])
plt.tight_layout()
plt.show()
But looking at other datasets, it's not really that easy to see the period of the seasonality, so it leads me to a couple of questions:
How do you find the correct arguments in real-world messy data, particularly the period argument but also the others too? Is it just a parameter search that you perform until the decomposition looks sane?
Parameters
endog : array_like Data to be decomposed. Must be squeezable to 1-d.
period : Periodicity of the sequence. If None and endog is a pandas Series or DataFrame, attempts to determine from endog. If endog is a ndarray, period must be provided.
seasonal : Length of the seasonal smoother. Must be an odd integer, and should normally be >= 7 (default).
trend : Length of the trend smoother. Must be an odd integer. If not provided uses the smallest odd integer greater than 1.5 * period / (1 - 1.5 / seasonal), following the suggestion in the original implementation.


periodparameter... – Pachisi