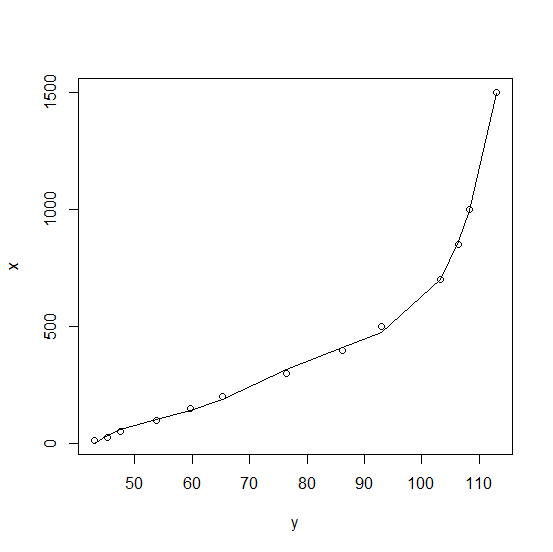
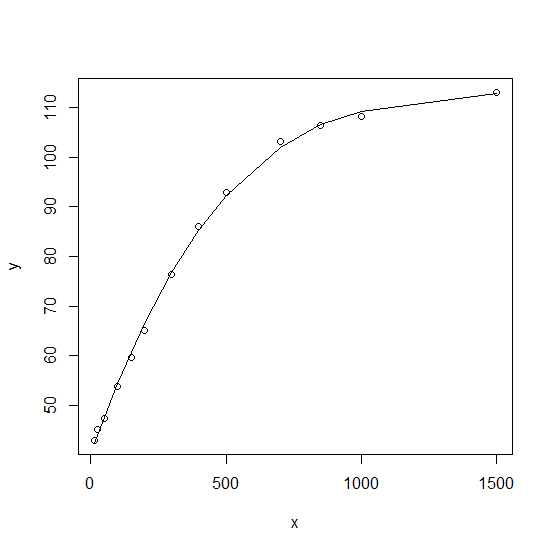
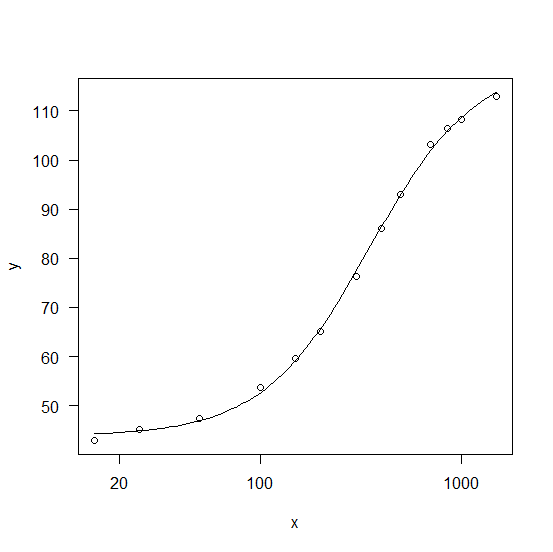
I'm having trouble finding the right curve to fit to my data. If someone more knowledgeable than me has an idea/solution for a better fitting curve I would be really grateful.
Data: The aim is to predict x from y
dat <- data.frame(x = c(15,25,50,100,150,200,300,400,500,700,850,1000,1500),
                  y = c(43,45.16,47.41,53.74,59.66,65.19,76.4,86.12,92.97,
                        103.15,106.34,108.21,113) )
This is how far I've come:
model <- nls(x ~ a * exp( (log(2) / b ) * y),
             data = dat, start = list(a = 1, b = 15 ), trace = T)
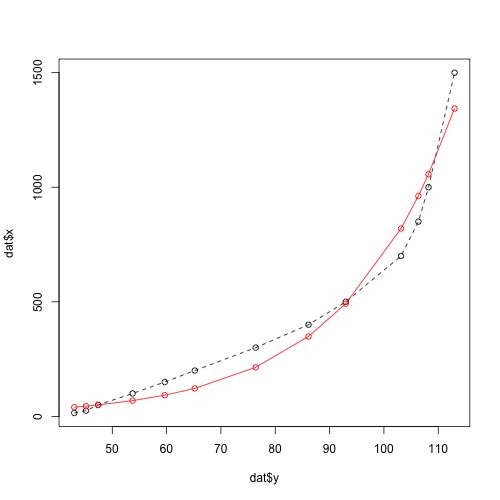
Which is not a great fit:
dat$pred <- predict(model, list(y = dat$y))
plot( dat$y, dat$x, type = 'o', lty = 2)
points( dat$y, dat$pred, type = 'o', col = 'red')
Thanks, F


plotfunction in R, first argument isxargument and second argument isy. You have plotteddat$xonyaxis. You might want to correct it. – Puma