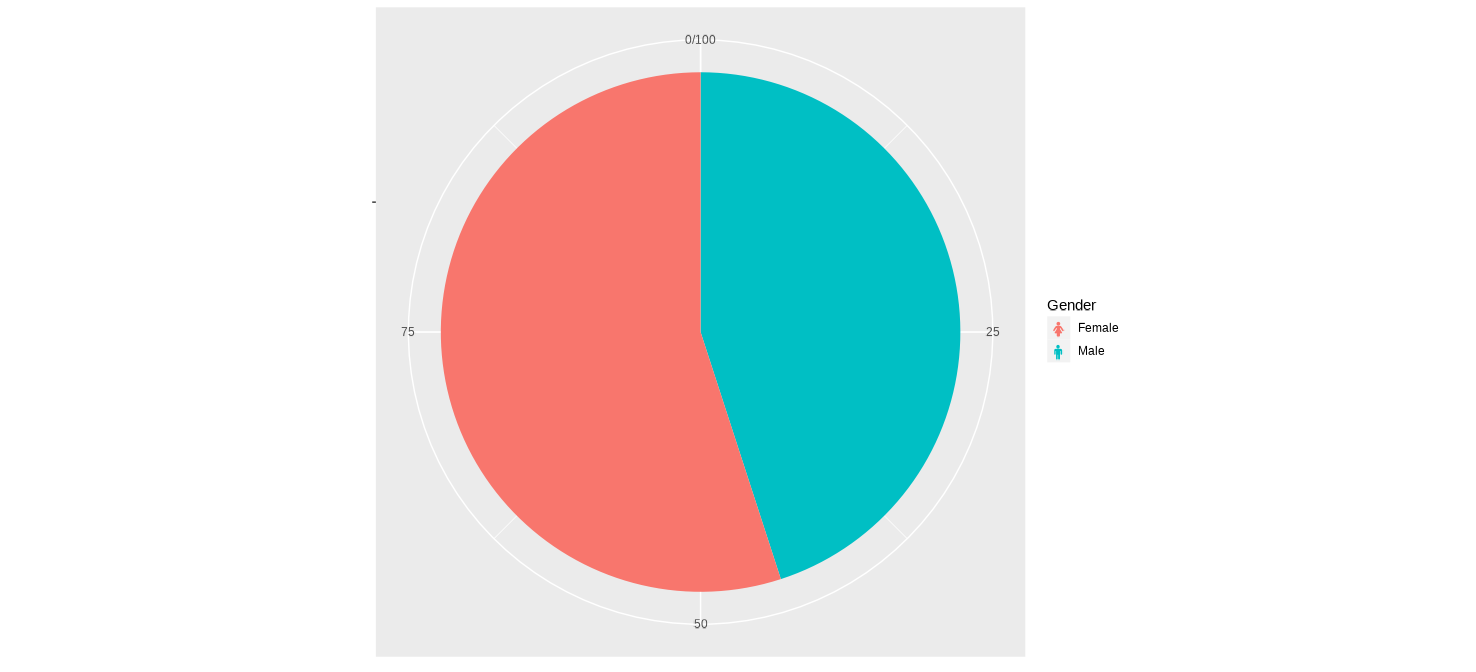
I have the below code which produces a pie chart and a legend. Is there a way to get the emoji and the pie chart to be the same corresponding colour, as at the moment the emojis are black. Also I would like the square colour blocks in the legend removed, and the terms male and female to appear next to the correct emoji
library(tidyverse)
library(emojifont)
load.emojifont("OpenSansEmoji.ttf")

gender<-data.frame(`Gender`=c("Male","Female"),
                   `Proportion`=c(45,55), symbol=c("\UF182","\UF183"))

ggplot(gender, aes(x="", Proportion, fill=symbol, label=symbol)) +
  geom_bar(width = 1, stat = "identity")+
  coord_polar("y", start=0)+
  xlab(NULL)+ylab(NULL) +
  theme(legend.text=element_text(family='fontawesome-webfont'))

