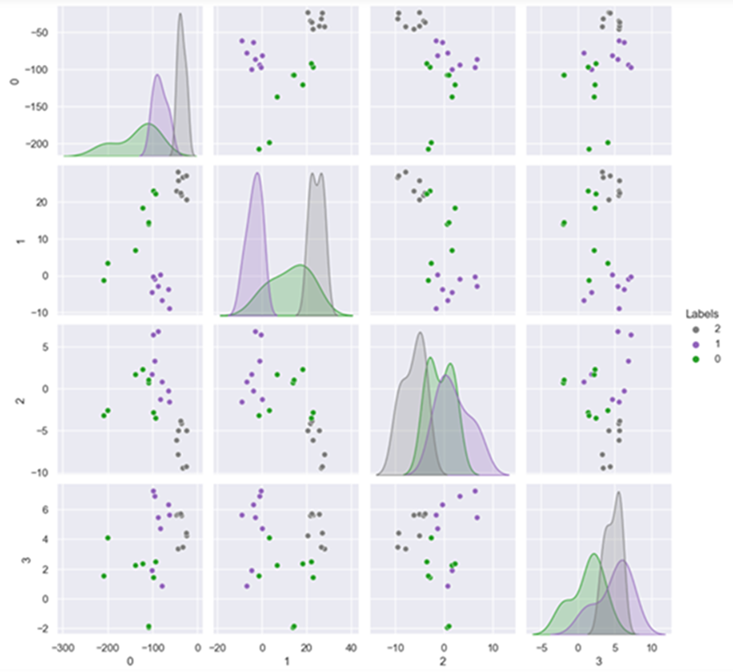
I get a seaborn.pairplot plot (using the tab10_r palette) like this:
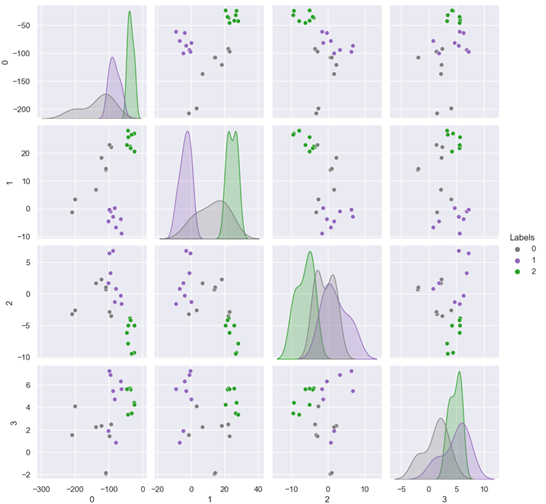
If I change the order of the classes now to [0 1 2], to the same plot, I get this:
I wanted to plot the same data but three different ways with the classes being in different order each time. However, each time the order is different, I wanted to keep the color the same for the labels on each plot. That is, Label 0 should be green, Label 1 should be purple and Label 2 should be grey in all cases.
Can you assist me in keep the color tied to the Labels?
This is the code that I am currently using:
import seaborn as sns
import pandas as pd

data = {'Feat1': [-46.220314, -23.80669, -42.092365, -35.29639, -37.075096, -42.8849, -32.3057, -24.469942, -97.89892, -81.96325, -78.41986, -100.68544, -87.05412, -64.121056, -94.504845, -61.951996, -108.19452, -97.4037, -92.641335, -199.18787, -137.5976, -208.0035, -108.225975, -121.29299],
        'Feat2': [22.862856, 20.536781, 25.680704, 21.709473, 22.347767, 28.03802, 26.568039, 27.005375, -0.38156664, 0.1821717, -6.766374, -4.5810957, -2.9231584, -3.7892206, -0.9999217, -8.960198, 13.909201, 22.897585, 22.10624, 3.3090565, 6.795896, -1.33229, 14.341716, 18.274035],
        'Feat3': [-6.1573067, -5.015675, -5.0092897, -4.160352, -3.860426, -7.8572545, -9.47018, -9.301921, 6.4163384, -1.2870358, 0.8001185, 1.6977689, 6.817379, -0.283514, 3.2884297, -1.5915259, 0.6966458, -2.8488266, -3.5110545, -2.5994794, 1.6793671, -3.2078092, 1.02891, 2.2891548],
        'Feat4': [5.6060414, 4.2216353, 5.665794, 5.578346, 5.6953945, 3.3361, 3.4532788, 4.3995037, 7.234347, 4.703838, 0.83444935, 1.8801615, 5.4460077, 6.3084154, 6.881124, 5.6160254, -1.956591, 1.4105041, 2.467166, 4.0802555, 2.2256763, 1.5177402, -1.8651972, 2.3360753],
        'Labels': [2, 2, 2, 2, 2, 2, 2, 2, 1, 1, 1, 1, 1, 1, 1, 1, 0, 0, 0, 0, 0, 0, 0, 0]}
df = pd.DataFrame(data)
df1 = df.copy()
df2 = df.copy()

df1['Labels'] = y_train.astype(str) #Make it string
df1.Labels = pd.Categorical(values=df1.Labels, categories=['2', '1', '0'], ordered=True)

sns.set(style='darkgrid', context='notebook')
sns.pairplot(df1, hue='Labels', palette='tab10_r')

df2['Labels'] = y_train.astype(str) #Make it string
df2.Labels = pd.Categorical(values=df2.Labels, categories=['0', '1', '2'], ordered=True)
sns.pairplot(df2, hue='Labels', palette='tab10_r')


df1.Labels = pd.Categorical(values=df1.Labels, categories=['0', '1', '2'], ordered=True)and then the same fordf2.Labels. – Thoroughpaceddictfor the colors: 1.colors = {'0': "#F28E2B", '1': "#4E79A7", '2': "#79706E"}2.palette=colors. You'll have to figure out the correct color code. – Thoroughpacedcolors = dict(zip(['0', '1', '2'], sns.color_palette('tab10_r', 3)))– Thoroughpaced