There is no standard curve that does this; however, it may be possible if duplicating adding additional points to coerce a standard d3 curve to be flat where needed. For example, adding points before and after the stage change with the same y value.
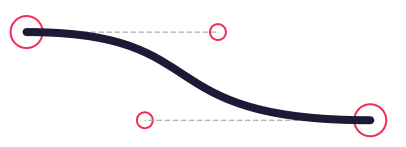
However, a custom curve could work and avoid the need for data manipulation. A bezier curve should do the trick. With origin, destination, and control points something like:
![enter image description here]()
Image from this codepen
To implement this idea we can replace the point function in a standard curve, such as d3.curveLinear with one that draws a bezier curve.
The point function of d3.curveLinear for comparison:
  function(x, y) {
    x = +x, y = +y;
    switch (this._point) {
      case 0: this._point = 1; this._line ? this._context.lineTo(x, y) : this._context.moveTo(x, y); break;
      case 1: this._point = 2; // proceed
      default: this._context.lineTo(x, y); break;
    }
And the new point function:
  function(x,y) {
    x = +x, y = +y;
    switch (this._point) {
      case 0: this._point = 1;
        this._line ? this._context.lineTo(x, y) : this._context.moveTo(x, y);
        this.x0 = x; this.y0 = y;
        break;
      case 1: this._point = 2;
      default:
        var x1 = this.x0 * 0.5 + x * 0.5;
        this._context.bezierCurveTo(x1,this.y0,x1,y,x,y); // bezierCurveTo(controlPoint1X,controlPoint1Y,controlPoint2X,controlPoint2Y,endPointX,endPointY)
        this.x0 = x; this.y0 = y;
        break;
    }
  }
  return custom;
}
I'm using the same x value for each control point, this might not be ideal as they may not be flat enough at the ends, but it is easily changed
We can create a custom curve by using d3.curveLinear and substituting in this new point function:
var curve = function(context) {
  var custom = d3.curveLinear(context);
  custom._context = context;
  custom.point = function(x,y) {
    x = +x, y = +y;
    switch (this._point) {
      case 0: this._point = 1;
        this._line ? this._context.lineTo(x, y) : this._context.moveTo(x, y);
        this.x0 = x; this.y0 = y;
        break;
      case 1: this._point = 2;
      default:
        var x1 = this.x0 * 0.5 + x * 0.5;
        this._context.bezierCurveTo(x1,this.y0,x1,y,x,y);
        this.x0 = x; this.y0 = y;
        break;
    }
  }
  return custom;
}
This works easily enough:
var curve = function(context) {
  var custom = d3.curveLinear(context);
  custom._context = context;
  custom.point = function(x,y) {
    x = +x, y = +y;
    switch (this._point) {
      case 0: this._point = 1;
        this._line ? this._context.lineTo(x, y) : this._context.moveTo(x, y);
        this.x0 = x; this.y0 = y;
        break;
      case 1: this._point = 2;
      default:
        var x1 = this.x0 * 0.5 + x * 0.5;
        this._context.bezierCurveTo(x1,this.y0,x1,y,x,y);
        this.x0 = x; this.y0 = y;
        break;
    }
  }
  return custom;
}

var data = [
 [10,10],
 [160,50],
 [310,100]
];

var line = d3.line()
  .curve(curve);

d3.select("svg")
  .append("path")
  .attr("d",line(data));

d3.select("svg")
  .selectAll("circle")
  .data(data)
  .enter()
  .append("circle")
  .attr("transform", function(d) {
    return "translate("+d+")";
  })
  .attr("r",3)
path {
  fill: none;
  stroke: black;
  stroke-width:1px;
}
<script src="https://cdnjs.cloudflare.com/ajax/libs/d3/5.7.0/d3.min.js"></script>
<svg width="500" height="500"></svg>
And here's an areal demonstration that draws a funnel for each stage. Depending on your data this may or may not be preferable. My fake data is structured by stage, so it is easiest to draw each stage individually. Unifying all the stages into one path/area may be a bit more difficult.
var curve = function(context) {
  var custom = d3.curveLinear(context);
  custom._context = context;
  custom.point = function(x,y) {
    x = +x, y = +y;
    switch (this._point) {
      case 0: this._point = 1;
        this._line ? this._context.lineTo(x, y) : this._context.moveTo(x, y);
        this.x0 = x; this.y0 = y;
        break;
      case 1: this._point = 2;
      default:
        var x1 = this.x0 * 0.5 + x * 0.5;
        this._context.bezierCurveTo(x1,this.y0,x1,y,x,y);
        this.x0 = x; this.y0 = y;
        break;
    }
  }
  return custom;
}

var data = [
  {stage:1, start:1,end:0.5},
  {stage:2, start:0.5,end:0.2},
  {stage:3, start:0.2,end:0.1},
  {stage:4, start:0.1,end:0.005}
]

var yRangeMax = 100;
var y = d3.scaleLinear()
  .range([yRangeMax,0]);

var x = d3.scaleBand()
  .range([50,400])
  .domain(data.map(function(d) {
    return d.stage;
  }))

var svg = d3.select("svg");

var area = d3.area()
  .curve(curve)
  .y1(function(d) { return yRangeMax*2-d[1]; })
  .y0(function(d) { return d[1]; })

svg.selectAll(null)
  .data(data)
  .enter()
  .append("path")
  .attr("d", function(d) {
    var p1 = [x(d.stage),y(d.start)]
    var p2 = [x(d.stage)+x.step(),y(d.end)]
    return area([p1,p2])
  })
path{
  stroke: #bbb;
  stroke-width: 1px;
  fill:#ccc;
}
<script src="https://cdnjs.cloudflare.com/ajax/libs/d3/5.6.0/d3.min.js"></script>
<svg width="600" height="400"></svg>
As for guidance on custom curves, there are not a lot of resources that I've seen. However, these answers (a,b) might be of some assistance.

