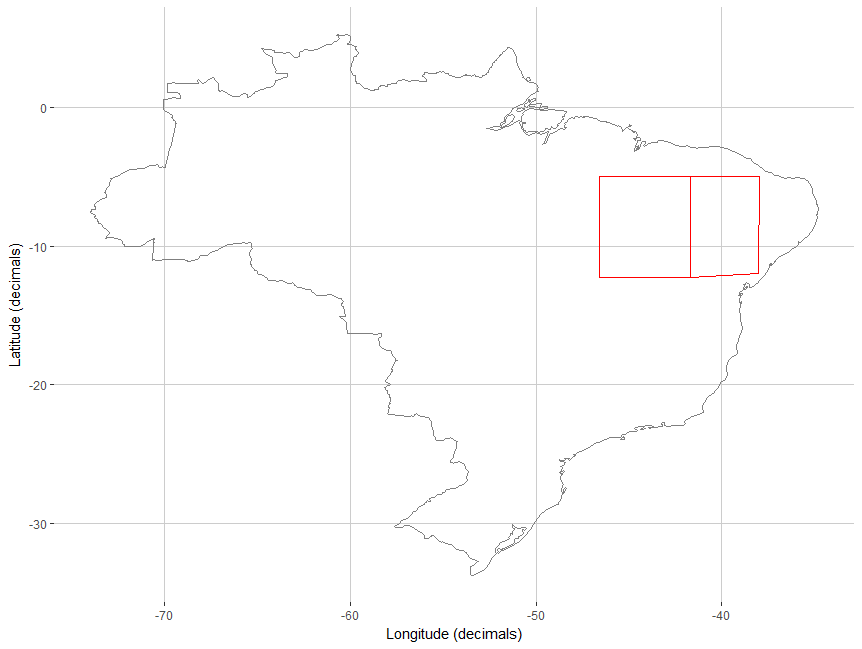
I have some questions about maps/shapefiles. I'm not a expert in R, so, to make it easier do understand what I'm going for, I'll enumerate:
1- Identify each grid on the map, and maybe omit some of these grids. 2- Color each grid by values from a data frame
I just made what i'm trying to make using Photoshop to help to illustrate my goal here
I made this map using the 'intersect' function with a shapefile I got from internet and a grid i made using 'rastertoPolygons' function, but I'm not sure if using a .shp is the best way to get what I want, altough it has been the only way I found to do this, since I got lost trying with ggplot2 options (and I'm very familiar with the package)
Any help or suggestion will be awesome.
Sorry if I made a stupid question and sorry for my bad english.

