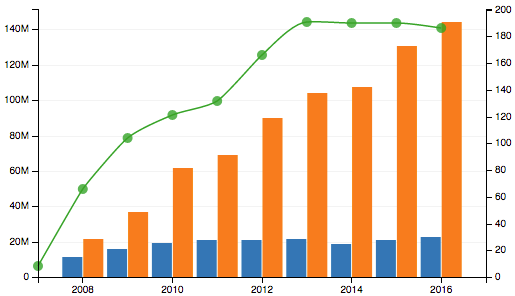
I am trying to produce a bar graph that has multiple hierarchical / groupings of factors using d3.js. An example from excel of what I am attempting to create, subgrouped by Variety and Irrigation treatment:

I have searched for quite some time and have yet to see an example of something like the example graph above. The closet I found is this (as well as this, this, and this).
but they all lack the one more level of grouping that I need.
Is there a way to create multiple groupings in d3.js, or any other reusable charts based on d3.js, like dc.js?
If so, a demo chart is appreciated. You can use this csv data.
Chart Population1, Population2 etc for each countries, and group them by Continent.
UPDATE:
@Gordon, thanks for your reply and links. One thing though, are you sure the pull request is about multiple sub groups? From the posted pictures in the thread, it looks like just normal grouping to me:
which is already available in d3, e.g.,
http://bl.ocks.org/mbostock/882152
Thanks for any help you may have!


v-a,v-b,v-cetc from the axis to the legend? Basically that code works, but not reusable (look at the hard-codedv-a,v-b,v-cetc in the js code). I'm not a JavaScript developer to understand and adapt the code myself, so I'm seeking a reusable solution (e.g., work for any number of Population columns). Thanks for any help! – Otila