how to apply a three point triangle gradient in opencv?
Asked Answered
D

4

2

Say we have a Delaunay-triangulation like this one:

enter image description here

produced from fillConvexPoly on getVoronoiFacetList

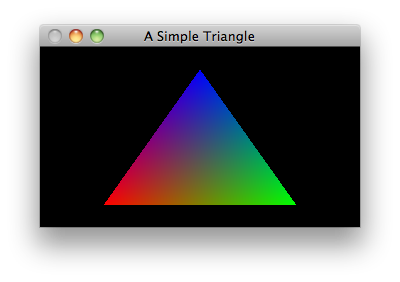
Inside there are triangles that can be obtained via getTriangleList. I want to draw Delaunay-triangulation like it is a smooth gradient image composed of triangles like this:

enter image description here

How to do such thing in opencv?

Diagnose answered 17/5, 2020 at 16:10 Comment(2)
See codeplea.com/triangular-interpolationFlews
Also see gamedev.stackexchange.com/questions/23743/… and #31443326Flews
F
3

This is how to do it in Python/OpenCV, but it will be slower than the Python/Wand version that I previously presented, because it has to loop and solve a linear least squares equation at each pixel for the barycentric coordinates.

import cv2
import numpy as np

# References: 
# https://mcmap.net/q/1370007/-increasing-efficiency-of-barycentric-coordinate-calculation-in-python
# https://math.stackexchange.com/questions/81178/help-with-cramers-rule-and-barycentric-coordinates

# create black background image
result = np.zeros((500,500,3), dtype=np.uint8)

# Specify (x,y) triangle vertices
a = (250,100)
b = (100,400)
c = (400,400)

# Specify colors
red = (0,0,255)
green = (0,255,0)
blue = (255,0,0)

# Make array of vertices
# ax bx cx
# ay by cy
#  1  1  1
triArr = np.asarray([a[0],b[0],c[0], a[1],b[1],c[1], 1,1,1]).reshape((3, 3))

# Get bounding box of the triangle
xleft = min(a[0], b[0], c[0])
xright = max(a[0], b[0], c[0])
ytop = min(a[1], b[1], c[1])
ybottom = max(a[1], b[1], c[1])

# loop over each pixel, compute barycentric coordinates and interpolate vertex colors
for y in range(ytop, ybottom):

    for x in range(xleft, xright):

        # Store the current point as a matrix
        p = np.array([[x], [y], [1]])

        # Solve for least squares solution to get barycentric coordinates
        (alpha, beta, gamma) = np.linalg.lstsq(triArr, p, rcond=-1)[0]

        # The point is inside the triangle if all the following conditions are met; otherwise outside the triangle
        if alpha > 0 and beta > 0 and gamma > 0:
            # do barycentric interpolation on colors
            color = (red*alpha + green*beta + blue*gamma)
            result[y,x] = color

# show results
cv2.imshow('result', result)
cv2.waitKey(0)
cv2.destroyAllWindows()

# save results
cv2.imwrite('barycentric_triange.png', result)


Result:

enter image description here

Flews answered 18/5, 2020 at 4:11 Comment(1)
Thanks for this ! I have modified this code for taking advantage of vector computation (supported by lstsq) and removing for loop for mush better performances. See my anwser.Jadda
J
4

I have modified the answer of @fmw42 to take advantage of vector computation (supported by np.linalg.lstsq) and remove for loops for better performances.

    #!/usr/bon/env python
    import cv2
    import numpy as np
    
    # create black background image
    result = np.zeros((500,500,3), dtype=np.uint8)
    
    # Specify (x,y) triangle vertices
    a = (250,100)
    b = (100,400)
    c = (400,400)
    
    # Specify colors
    red = np.array([0,0,255])
    green = np.array([0,255,0])
    blue = np.array([255,0,0])
    
    # Make array of vertices
    # ax bx cx
    # ay by cy
    #  1  1  1
    triArr = np.asarray([a[0],b[0],c[0], a[1],b[1],c[1], 1,1,1]).reshape((3, 3))
    
    # Get bounding box of the triangle
    xleft = min(a[0], b[0], c[0])
    xright = max(a[0], b[0], c[0])
    ytop = min(a[1], b[1], c[1])
    ybottom = max(a[1], b[1], c[1])
    
    # Build np arrays of coordinates of the bounding box
    xs = range(xleft, xright)
    ys = range(ytop, ybottom)
    xv, yv = np.meshgrid(xs, ys)
    xv = xv.flatten()
    yv = yv.flatten()
    
    # Compute all least-squares /
    p = np.array([xv, yv, [1] * len(xv)])
    alphas, betas, gammas = np.linalg.lstsq(triArr, p, rcond=-1)[0]
    
    # Apply mask for pixels within the triangle only
    mask = (alphas > 0) & (betas > 0) & (gammas > 0)
    alphas_m = alphas[mask]
    betas_m = betas[mask]
    gammas_m = gammas[mask]
    xv_m = xv[mask]
    yv_m = yv[mask]
    
    def mul(a, b) :
        # Multiply two vectors into a matrix
        return np.asmatrix(b).T @ np.asmatrix(a)
    
    # Compute and assign colors
    colors = mul(red, alphas_m) + mul(green, betas_m) + mul(blue, gammas_m)
    result[xv_m, yv_m] = colors
    
    # show results
    cv2.imshow('result', result)
    cv2.waitKey(0)
    cv2.destroyAllWindows()
Jadda answered 3/8, 2021 at 8:46 Comment(0)
F
3

This is how to do it in Python/OpenCV, but it will be slower than the Python/Wand version that I previously presented, because it has to loop and solve a linear least squares equation at each pixel for the barycentric coordinates.

import cv2
import numpy as np

# References: 
# https://mcmap.net/q/1370007/-increasing-efficiency-of-barycentric-coordinate-calculation-in-python
# https://math.stackexchange.com/questions/81178/help-with-cramers-rule-and-barycentric-coordinates

# create black background image
result = np.zeros((500,500,3), dtype=np.uint8)

# Specify (x,y) triangle vertices
a = (250,100)
b = (100,400)
c = (400,400)

# Specify colors
red = (0,0,255)
green = (0,255,0)
blue = (255,0,0)

# Make array of vertices
# ax bx cx
# ay by cy
#  1  1  1
triArr = np.asarray([a[0],b[0],c[0], a[1],b[1],c[1], 1,1,1]).reshape((3, 3))

# Get bounding box of the triangle
xleft = min(a[0], b[0], c[0])
xright = max(a[0], b[0], c[0])
ytop = min(a[1], b[1], c[1])
ybottom = max(a[1], b[1], c[1])

# loop over each pixel, compute barycentric coordinates and interpolate vertex colors
for y in range(ytop, ybottom):

    for x in range(xleft, xright):

        # Store the current point as a matrix
        p = np.array([[x], [y], [1]])

        # Solve for least squares solution to get barycentric coordinates
        (alpha, beta, gamma) = np.linalg.lstsq(triArr, p, rcond=-1)[0]

        # The point is inside the triangle if all the following conditions are met; otherwise outside the triangle
        if alpha > 0 and beta > 0 and gamma > 0:
            # do barycentric interpolation on colors
            color = (red*alpha + green*beta + blue*gamma)
            result[y,x] = color

# show results
cv2.imshow('result', result)
cv2.waitKey(0)
cv2.destroyAllWindows()

# save results
cv2.imwrite('barycentric_triange.png', result)


Result:

enter image description here

Flews answered 18/5, 2020 at 4:11 Comment(1)
Thanks for this ! I have modified this code for taking advantage of vector computation (supported by lstsq) and removing for loop for mush better performances. See my anwser.Jadda
F
2

In OpenCV, I do not believe that there is any readily available function to do that. You would have to loop over each pixel in the image and compute the barycentric (area) interpolation. See for example, https://codeplea.com/triangular-interpolation

However, in Python/Wand (based upon ImageMagick), you can do it as follows:

import numpy as np
from wand.image import Image
from wand.color import Color
from wand.drawing import Drawing
from wand.display import display

# define vertices of triangle
p1 = (250, 100)
p2 = (100, 400)
p3 = (400, 400)

# define barycentric colors and vertices
colors = {
    Color('RED'): p1,
    Color('GREEN1'): p2,
    Color('BLUE'): p3
}

# create black image
black = np.zeros([500, 500, 3], dtype=np.uint8)

with Image.from_array(black) as img:
    with img.clone() as mask:
        with Drawing() as draw:
            points = [p1, p2, p3]
            draw.fill_color = Color('white')
            draw.polygon(points)
            draw.draw(mask)
            img.sparse_color('barycentric', colors)
            img.composite_channel('all_channels', mask, 'multiply', 0, 0)   
            img.format = 'png'
            img.save(filename='barycentric_image.png')
            display(img)


Result:

enter image description here

Flews answered 17/5, 2020 at 19:52 Comment(8)
Hi, is there any way to use sparse_color with duplicate colors but different points? Like for example in this post picture example: #25910646Finnie
I am not sure what you want from that link. But you can use sparse_color Voronoi to have uniform colors. See imagemagick.org/Usage/canvas/#sparse-colorFlews
Yes sorry, I wasn't very clear. I'm a total beginner with python and python-wand. I tried your code and it's working perfectly, but I'm wondering if it's possible to give python-wand more than 3-4 points using the same colors. In the doc of python-wand, it is written that it accepts "dict mapping Color keys". So it means only one point per color ? Is there an alternative ? Use case would be to map for example 3 red points, 3 green points to different places and have the interpolation between all these points.Finnie
See the sparse-color link I gave you before. There are several methods. But I do not think any will do what you want, if I understand what you are asking. I am not sure I understand. Can you show pictures/diagrams of what points you want to change and how you want them filled?Flews
Sorry for the delay, here is a totally random example : helpx.adobe.com/content/dam/help/en/illustrator/using/gradients/… (just forget about the dear shape, I just want to generate a gradient with multipoints - is there a proper name for that)Finnie
See examples at imagemagick.org/Usage/canvas/#voronoi using Voronoi or Shepards methodsFlews
You could just apply a Gaussian blur to your voronoi resultFlews
Thanks, I didn't even think of that !Finnie
S
0

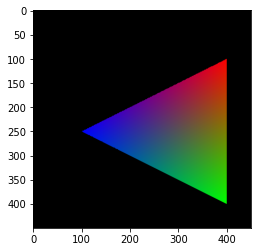
Implementing the same with scipy.spatial's Delaunay and computing barycentric coordinates using the transformation object, modifying @fmw42's implementation. For all the simplices (when number of simplices are small it will be fast) we can find the points inside a simplex, compute corresponding barycentric coordinate and the corresponding RGB value, as shown in the code below, along with the output obtained.

from scipy.spatial import Delaunay
import numpy as np
from time import time

t = time()

a, b, c = [250, 100], [100, 400], [400, 400]

tri = Delaunay(np.array([a, b, c]))

# bounding box of the triangle
xleft, xright = min(a[0], b[0], c[0]), max(a[0], b[0], c[0])
ytop, ybottom = min(a[1], b[1], c[1]), max(a[1], b[1], c[1])

xv, yv = np.meshgrid(range(xleft, xright), range(ytop, ybottom))
xv, yv = xv.flatten(), yv.flatten()

pp = np.vstack((xv, yv)).T
ss = tri.find_simplex(pp)
ndim = tri.transform.shape[2]
print(len(np.unique(ss)))
# 2

out = np.zeros((450,450,3), dtype=np.uint8)
for i in np.unique(ss): # for all simplices (triangles)
    p = pp[ss == i] # all points in the simplex
    # compute the barycentric coordinates of the points
    b = tri.transform[i, :ndim].dot(np.transpose(p) - tri.transform[i, ndim].reshape(-1,1))
    αβγ = np.c_[np.transpose(b), 1 - b.sum(axis=0)] 
    indices = np.where(np.all(αβγ>=0, axis=1))
    out[p[indices,0], p[indices,1]] = αβγ[indices]@np.array([[0,0,255], [0,255,0], [255,0,0]])

print(f'time: {time() - t} sec')
# time: 0.03899240493774414 sec

plt.imshow(out)

enter image description here

Sprang answered 2/6, 2023 at 1:20 Comment(0)

© 2022 - 2024 — McMap. All rights reserved.