I don't know if this is possible in dc.js and crossfilter.js, but I decided to ask anyways.
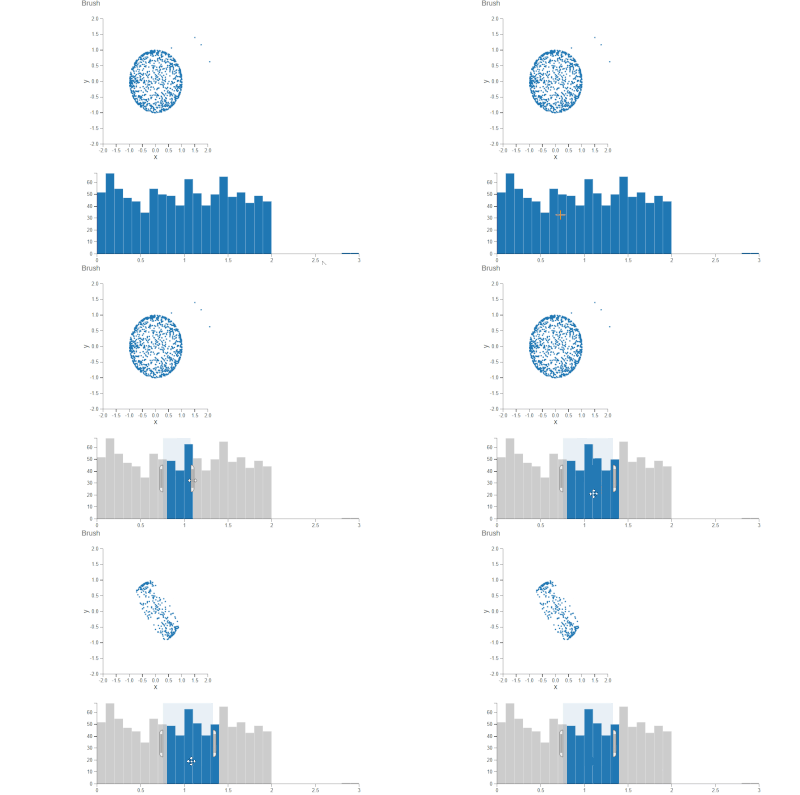
I combined a scatterplot and a barChart example from dc to make an interactive dashboard:
var chart1 = dc.scatterPlot("#test1");
var chart2 = dc.scatterPlot("#test2");

d3.csv("output.csv", function(error, data) {

        data.forEach(function (x) {
            x.x = +x.x;
            x.y = +x.y;
            x.z = +x.z;
        });
        var ndx = crossfilter(data),
            dim1 = ndx.dimension(function (d) {
                return [d.x, d.y];
            }),
            dim2 = ndx.dimension(function (d) {
                return Math.floor(parseFloat(d.z) * 10) / 10;
            }),

            group1 = dim1.group(),
            group2 = dim2.group(),

        chart1.width(300)
            .height(300)
            .x(d3.scale.linear().domain([-2, 2]))
            .y(d3.scale.linear().domain([-2, 2]))
            .yAxisLabel("y")
            .xAxisLabel("x")
            .clipPadding(10)
            .dimension(dim1)
            //.excludedOpacity(0.5)
            .excludedColor('#ddd')
            .group(group1)
            .symbolSize([2.5]);

        chart2
            .width(600)
            .dimension(dim2)
            .group(group2)
            .x(d3.scale.linear().domain([0,3]))
            .elasticY(true)
            .controlsUseVisibility(false)
            .barPadding([0.1])
            .outerPadding([0.05]);

        chart2.xAxis().tickFormat(function(d) {return d}); // convert back to base unit
        chart2.yAxis().ticks(10);

        dc.renderAll();

        });
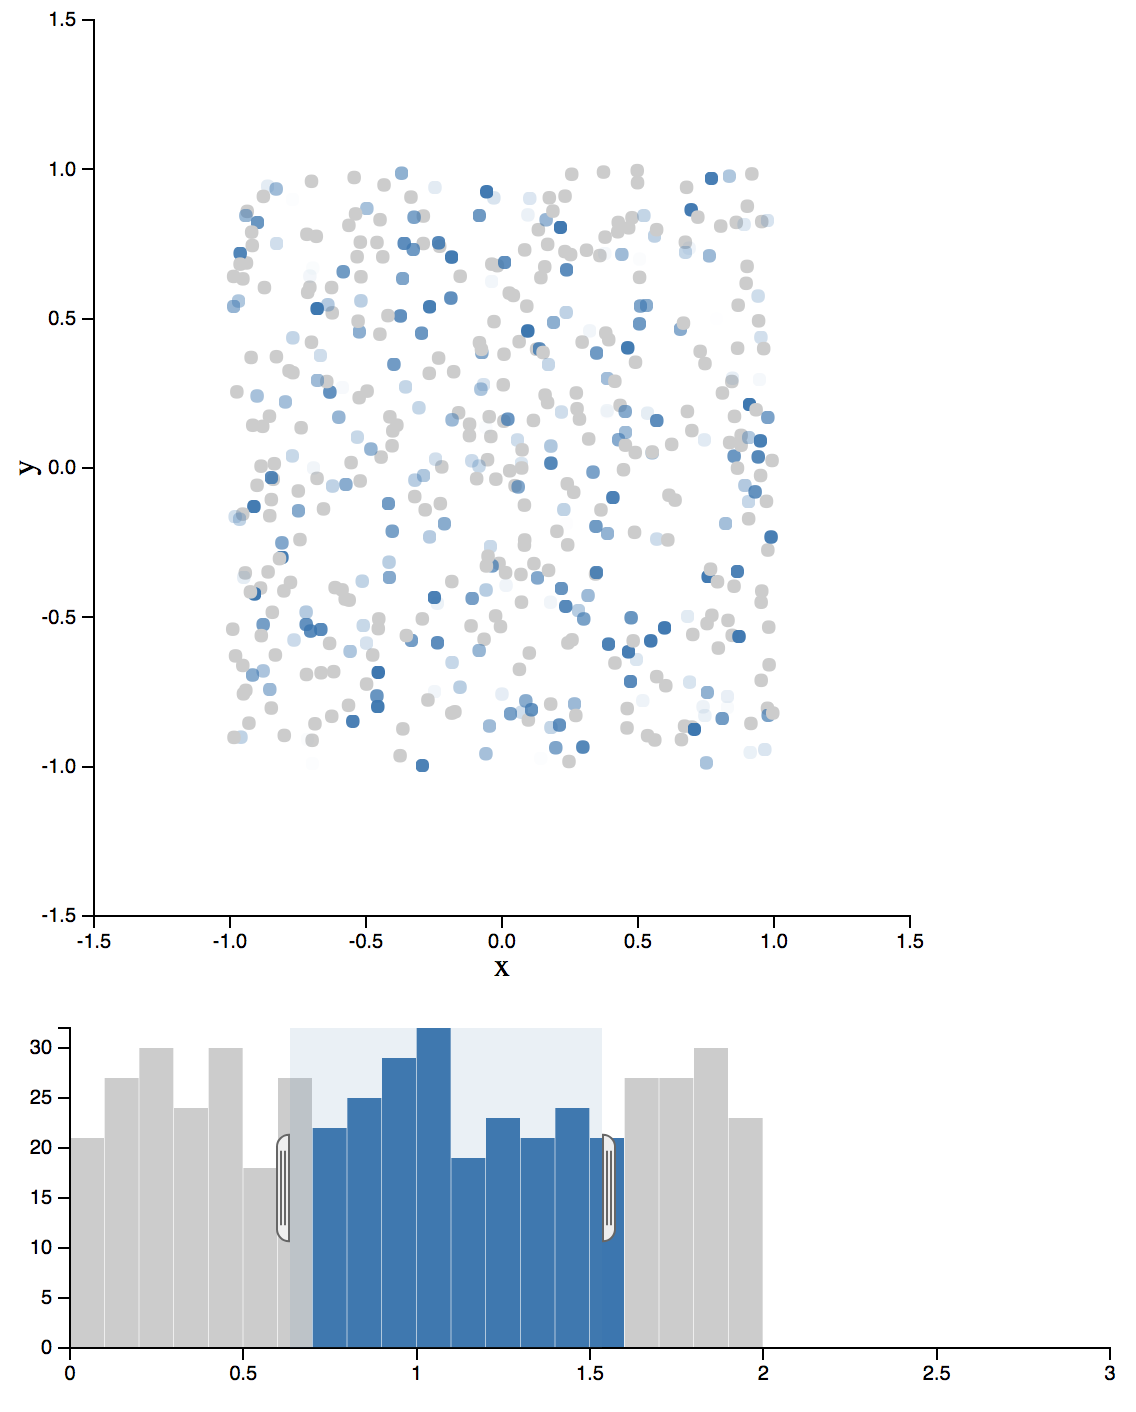
Result when brushing the bar chart:
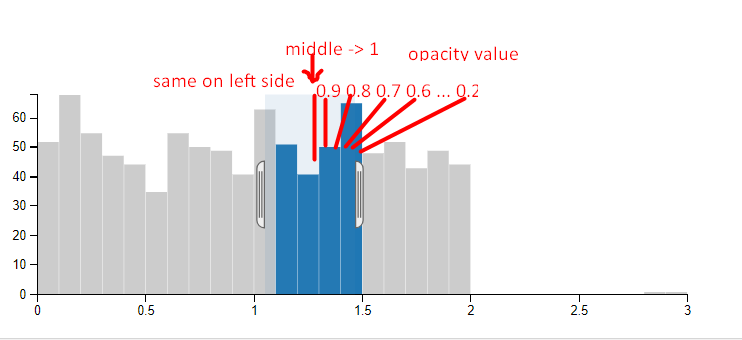
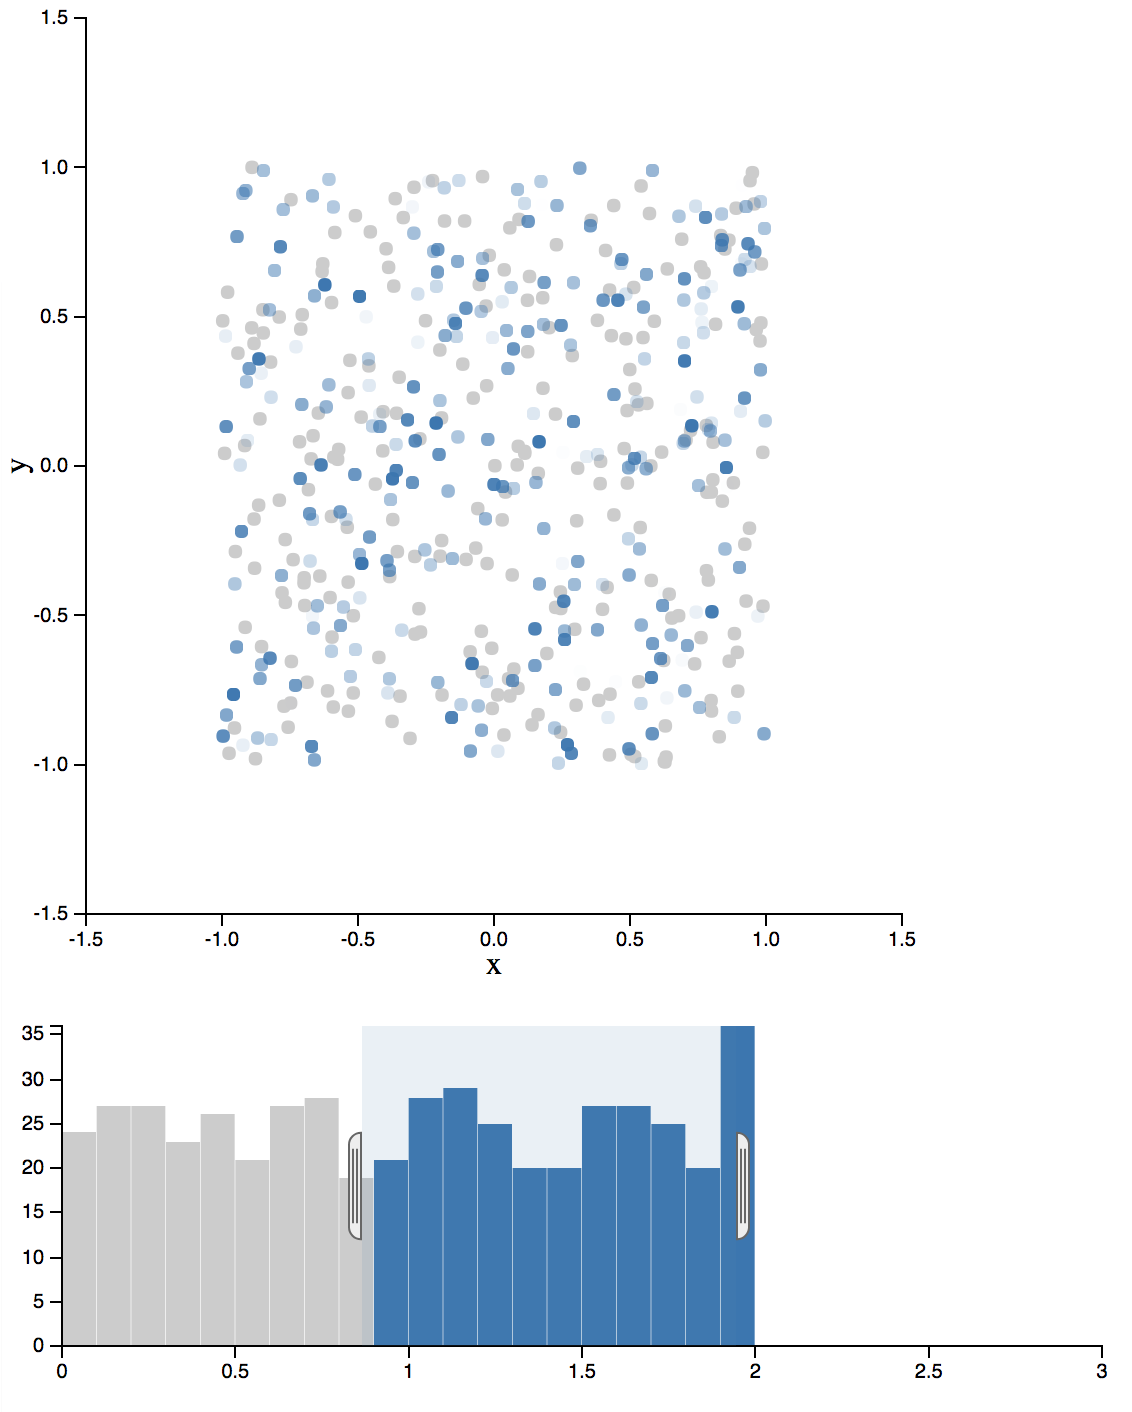
I want to change the filtering so that when I brush the bar chart, brushed points in the scatterplot will have an opacity value, which is 1 in the middle of the brush, and decreases towards end of the range of brush.
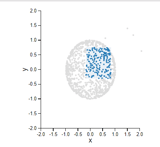
The other points (outside the brush) should just be grey, instead of invisible as in the current script. Illustration:
Is this possible to do with the dc.js and crossfilter.js?
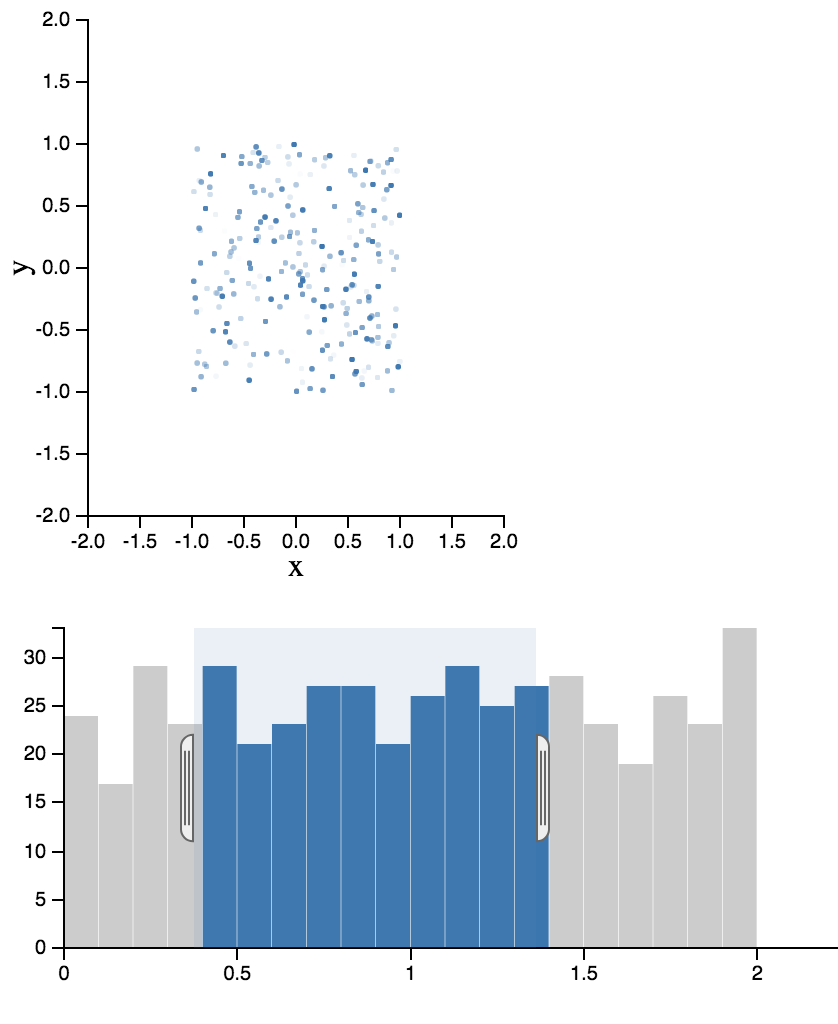
PS: The attached scatterplot isn't the desired outcome. It is not filtered based on opacity. I just attached it to show how the other points(grey) should look like after brushing the bar chart.

