Displaying multiple masks in different colours in pylab
Asked Answered
O

4

7

I've an array that includes decent observations, irrelevant observations (that I would like to mask out), and areas where there are no observations (that i would also like to mask out). I want to display this array as an image (using pylab.imshow) with two separate masks, where each mask is shown in a different colour.

I've found code for a single mask (here) in a certain colour, but nothing for two different masks:

masked_array = np.ma.array (a, mask=np.isnan(a))
cmap = matplotlib.cm.jet
cmap.set_bad('w',1.)
ax.imshow(masked_array, interpolation='nearest', cmap=cmap)

If possible, I'd like to avoid having to use a heavily distorted colour map but accept that that is an option.

Ophelia answered 14/11, 2012 at 17:41 Comment(1)
Yes, it's a 2D array filled with floats.Ophelia
A
4

You might simply replace values in you array with some fixed value depending on some conditions. For example, if you want to mask elements larger than 1 and smaller than -1:

val1, val2 = 0.5, 1
a[a<-1]= val1
a[a>1] = val2
ax.imshow(a, interpolation='nearest')

val1 and val2 can be modified to obtain colors you wish.

You can also set the colors explicitly, but it requires more work:

import matplotlib.pyplot as plt
from matplotlib import colors, cm

a = np.random.randn(10,10)

norm = colors.normalize()
cmap = cm.hsv
a_colors = cmap(norm(a))

col1 = colors.colorConverter.to_rgba('w')
col2 = colors.colorConverter.to_rgba('k')

a_colors[a<-0.1,:] = col1
a_colors[a>0.1,:] = col2
plt.imshow(a_colors, interpolation='nearest')
plt.show()
Astred answered 14/11, 2012 at 17:54 Comment(2)
That would work, though I would need to set the colour of the mask explicitly, as val1 could be any value and i don't want it to be able to distort the colors displayed (e.g. if my data values range form 0-1, and val1 is set to -999). Which method are you referring to that would allow me to explicitly set the colour?Ophelia
@Ophelia I added full implementetion with explicit color selection to my answer.Astred
L
4

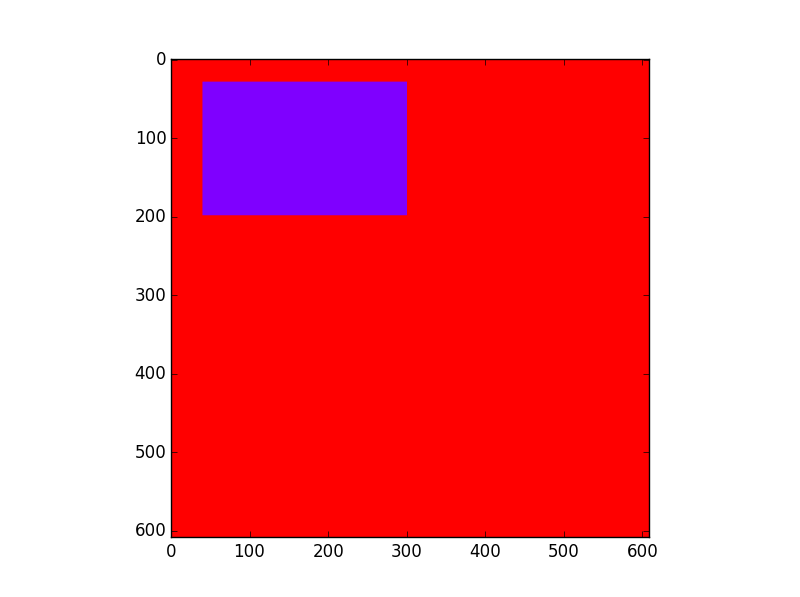
For me the simplest way is plotting directly the masks with imshow, passing different colormaps. Max and min of a colormap are used for True and False values:

mask1=np.isnan(a)
mask2=np.logical_not(mask1)
plt.imshow(mask1,cmap='gray')
plt.imshow(mask2,cmap='rainbow')

enter image description here

However this (and other approaches suggested) plot also False values overplotting previous plots. If you want to avoid plotting False values, it can be done by replacing them with np.nan, after converting the array to float (np.nan is of type float and cannot be contained in a boolean mask). nan values are not plotted:

mmm=mask.astype(np.float)
mmm[np.where(mmm==0)]=np.nan
#the substitution can be done also in one line with:
#mmm=np.where(mask,mask.astype(np.float),np.nan)
plt.imshow(mmm,cmap='rainbow',vmin=0,vmax=1)) #will use only the top color: red. vmin and vmax are needed if there are only one value (1.0=True) in the array.
plt.colorbar()
#repeat for other masks...

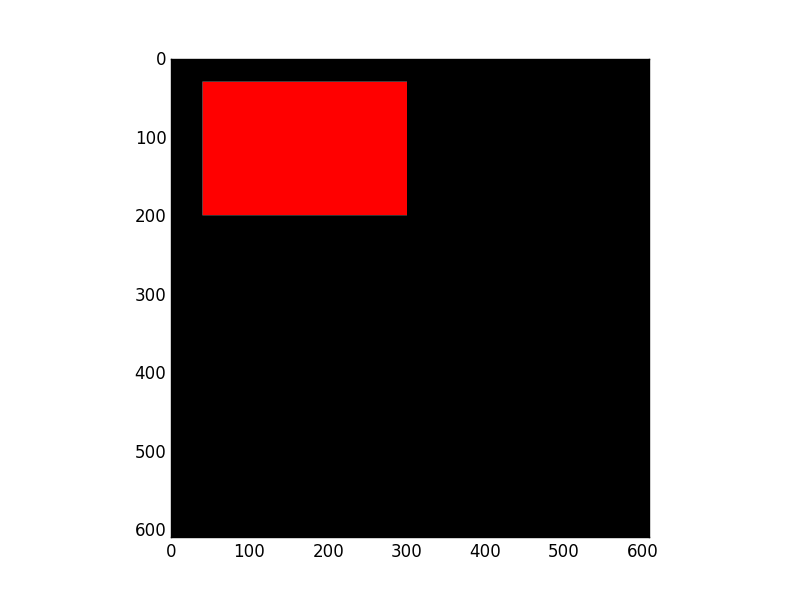
enter image description here And i hope I am not going too much off topic, but same technique can be used to plot different part of the data with different colormaps, by replacing the plotting command with:

plt.imshow(mmm*data,cmap='rainbow')

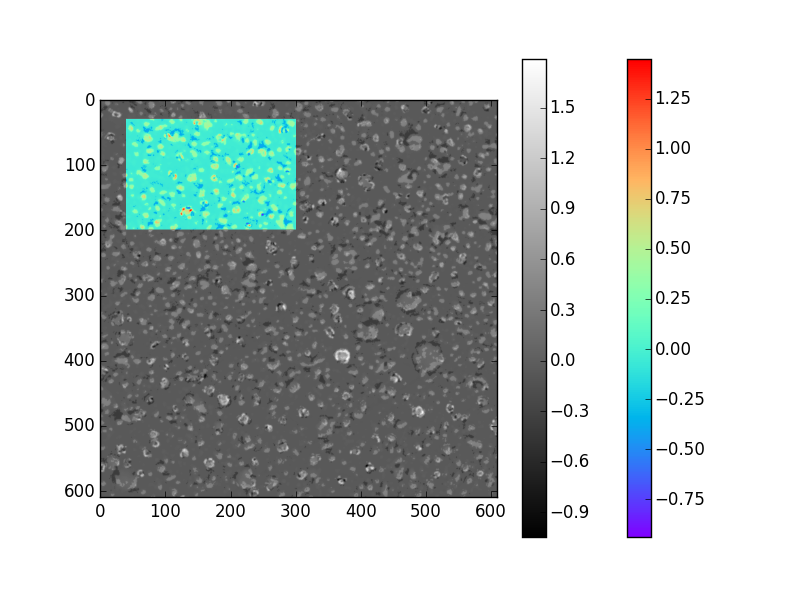
enter image description here

Liripipe answered 4/12, 2015 at 2:23 Comment(0)
P
2

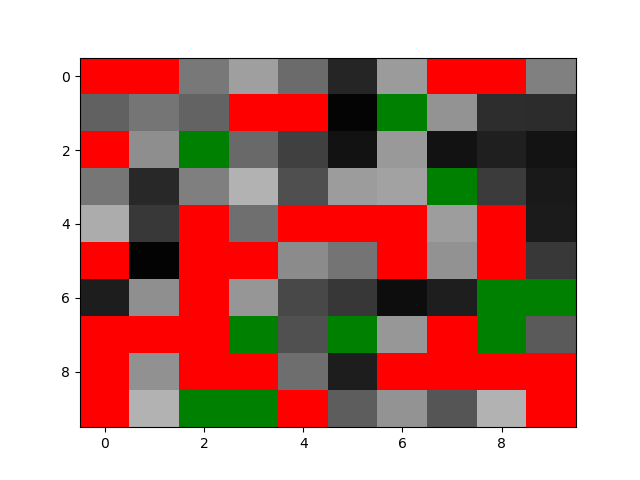
In order to color some pixels red and others green, as appears in the the following image, I used the code below. (See code comments for details.)

Example of two masks being used with a matplotlib matrix graph

import numpy as np              #Used for holding and manipulating data
import numpy.random             #Used to generate random data
import matplotlib as mpl        #Used for controlling color
import matplotlib.colors        #Used for controlling color as well
import matplotlib.pyplot as plt #Use for plotting

#Generate random data
a = np.random.random(size=(10,10))

#This 30% of the data will be red
am1 = a<0.3                                 #Find data to colour special
am1 = np.ma.masked_where(am1 == False, am1) #Mask the data we are not colouring

#This 10% of the data will be green
am2 = np.logical_and(a>=0.3,a<0.4)          #Find data to colour special
am2 = np.ma.masked_where(am2 == False, am2) #Mask the data we are not colouring

#Colourmaps for each special colour to place. The left-hand colour (black) is
#not used because all black pixels are masked. The right-hand colour (red or
#green) is used because it represents the highest z-value of the mask matrices
cm1 = mpl.colors.ListedColormap(['black','red'])
cm2 = mpl.colors.ListedColormap(['black','green'])

fig = plt.figure()                          #Make a new figure
ax = fig.add_subplot(111)                   #Add subplot to that figure, get ax

#Plot the original data. We'll overlay the specially-coloured data
ax.imshow(a,   aspect='auto', cmap='Greys', vmin=0, vmax=1)

#Plot the first mask. Values we wanted to colour (`a<0.3`) are masked, so they
#do not show up. The values that do show up are coloured using the `cm1` colour
#map. Since the range is constrained to `vmin=0, vmax=1` and a value of
#`cm2==True` corresponds to a 1, the top value of `cm1` is applied to all such
#pixels, thereby colouring them red.
ax.imshow(am1, aspect='auto', cmap=cm1, vmin=0, vmax=1);
ax.imshow(am2, aspect='auto', cmap=cm2, vmin=0, vmax=1);
plt.show()
Petit answered 25/6, 2018 at 7:30 Comment(0)
S
0

I don't know what the values are in your array, but you could convert the masked areas so that the X values become RGB(A) values (tuples of (R,G,B,A)), in which case the cmap is ignored, according to the documentation at least.

• cmap: [ None | Colormap ]

A matplotlib.colors.Colormap instance, eg. cm.jet. If None, default to rc image.cmap value. cmap is ignored when X has RGB(A) information

Shores answered 14/11, 2012 at 17:47 Comment(2)
Thanks, but as the array is filled with float data, I can't use RGB(A), unless I'm mistaken about that?Ophelia
No the idea is that you replace what ever is in the array with the RGBA colour you want to use for the plotShores

© 2022 - 2024 — McMap. All rights reserved.