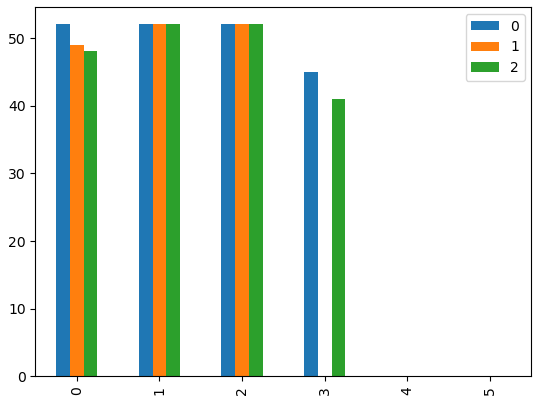
I'm trying to produce a bar chart with all the observations in my DataFrame, which looks like this:
import pandas as pd

data = {0: [52, 52, 52, 45, 0, 0],
        1: [49, 52, 52, 0, 0, 0],
        2: [48, 52, 52, 41, 0, 0]}

# (rows = years, columns = objects, values = violations of object in year)
cluster_yearly_results_df = pd.DataFrame(data)

    0   1   2
0  52  49  48
1  52  52  52
2  52  52  52
3  45   0  41
4   0   0   0
5   0   0   0
I'm getting the right type of graph when using the default pandas plot:
cluster_yearly_results_df.plot.bar()
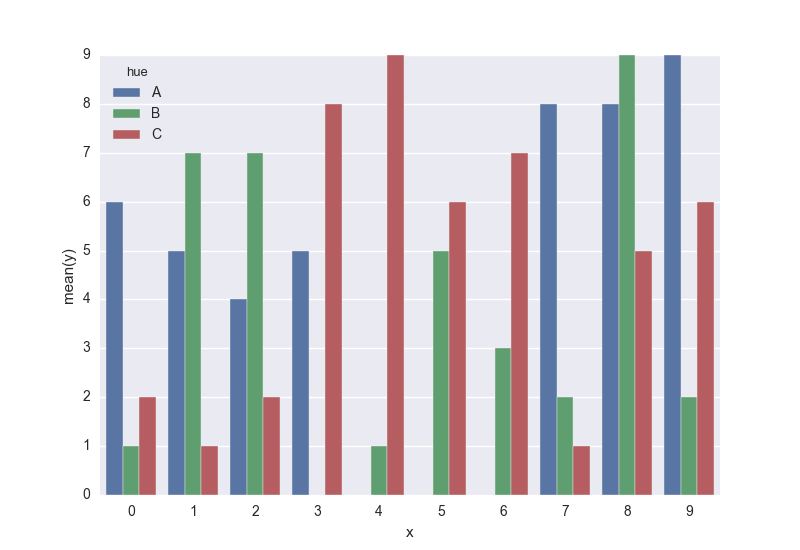
However, I would like to use seaborn, and I am having trouble inputting wide-form dataframes, using:
sns.barplot(data=cluster_yearly_results_df)
Can I use seaborn for what I want to do?


