How to assign custom color to masked cells in seaborn heatmap?
Asked Answered
T

2

7

I have a dataset with values -4 to 4 and some nan values. I plot the heatmap using seaborn heatmap. Colormap I need to use is from red to white to blue. My problem is masked cells are also white/greyish which is hard to differentiate then values close to 0 in colormap.

Is there any way to assign nan values as black without plotting the heatmap twice?

Torritorricelli answered 18/9, 2018 at 19:4 Comment(0)
O
9

You have two options.

  1. Use the bad value of the colormap. I.e. if masked values are set to nan, they would be shown in the color set to the colormap via

    colormap.set_bad("black") 
    
  2. Make the background of the axes black, such that values which are masked and hence not plotted appear as transparent with the background color see through,

    ax.set_facecolor("black")
    
Oriel answered 18/9, 2018 at 19:9 Comment(0)
F
1
  • .cm.get_cmap was deprecated in matplotlib 3.7
    • Use mpl.colormaps['viridis'] or mpl.colormaps.get_cmap('viridis') instead.
import seaborn as sns
import numpy as np
import matplotlib as mpl

np.random.seed(2023)
matrix = np.random.random_sample(size=(10, 10)) - 0.5

mask = np.where(np.logical_or(matrix >= 0.2, matrix <= -0.2), True, False)

cmap = mpl.colormaps.get_cmap('viridis')
cmap.set_bad("k")

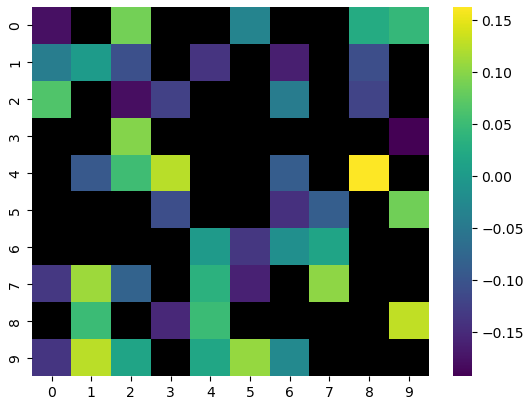
sns.heatmap(matrix, cmap=cmap, mask=mask)

enter image description here


Here is a full example:

import matplotlib as mpl
import seaborn as sns
cmap = mpl.cm.get_cmap('gray_r')
cmap.set_bad("white")
sns.heatmap(..., cmap=cmap)
Fingerling answered 24/3, 2023 at 7:56 Comment(0)

© 2022 - 2024 — McMap. All rights reserved.